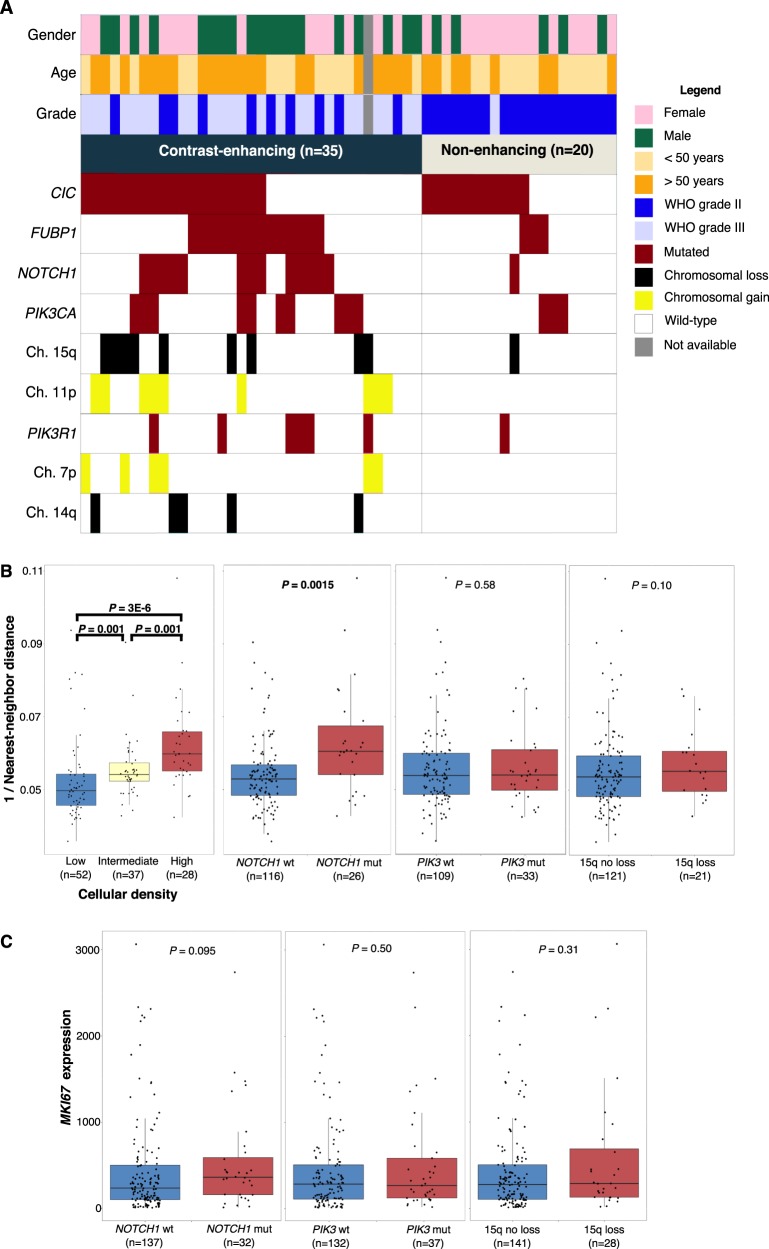
Fig. 3.
Genetic alterations associated with advanced disease progression a Waterfall plot illustrating the mutational landscape of oligodendrogliomas based on radiographic features of progression. b Boxplots demonstrating nearest-neighbor validation, and differential 1/nearest-neighbor distances in key genetic alterations of oligodendroglioma. c Boxplots for differential MKI67 expression in key genetic alterations of oligodendroglioma. P values determined using Wilcoxon rank sum tests

