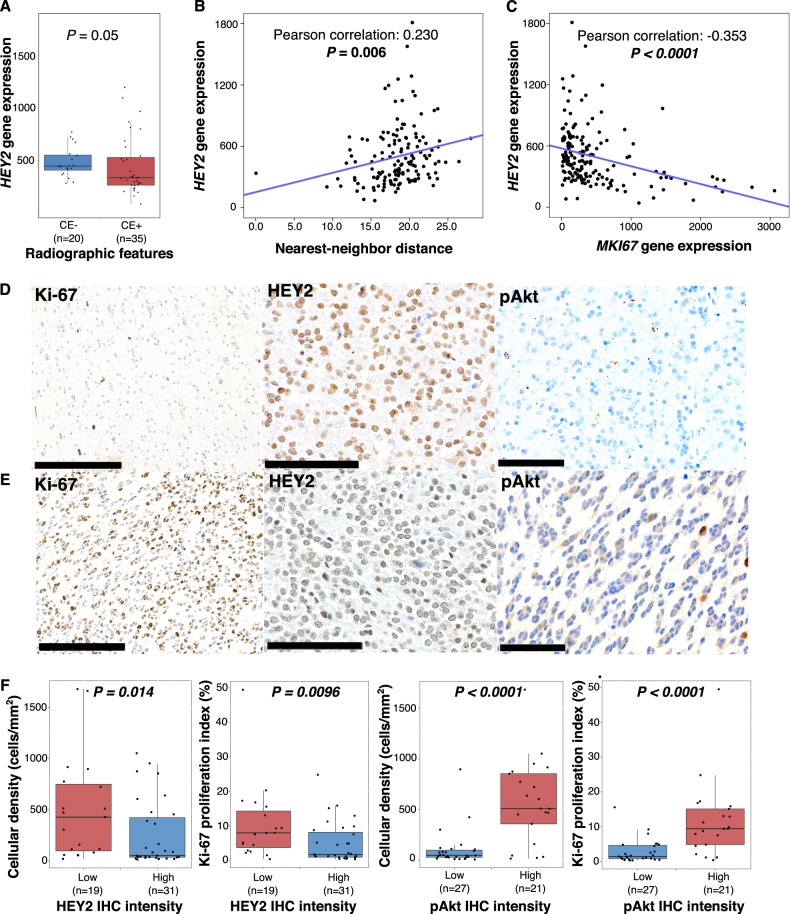
Fig. 4.
HEY2 associations with advanced disease and validation cohort. a Boxplots demonstrating differential HEY2 gene expression in CE− and CE+; P value determined using Wilcoxon rank-sum test. b Linear regression of HEY2 gene expression and nearest-neighbor distance, demonstrating positive correlation. c Linear regression of HEY2 and MKI67 expression, demonstrating negative correlation. P values from Pearson correlation. d IHC showing high Ki-67 proliferation index (25%) (bar, 250 μm), with corresponding absent HEY2 expression (bar, 100 μm) and high pAkt expression (bar 100 μm). e IHC showing low Ki-67 proliferation index (1%) (bar, 250 μm), with corresponding high HEY2 expression (bar, 100 μm) and absent pAkt expression (bar, 100 μm). f HEY2 and pAKT IHC intensity as related to cellular density and Ki-67 proliferation indices

