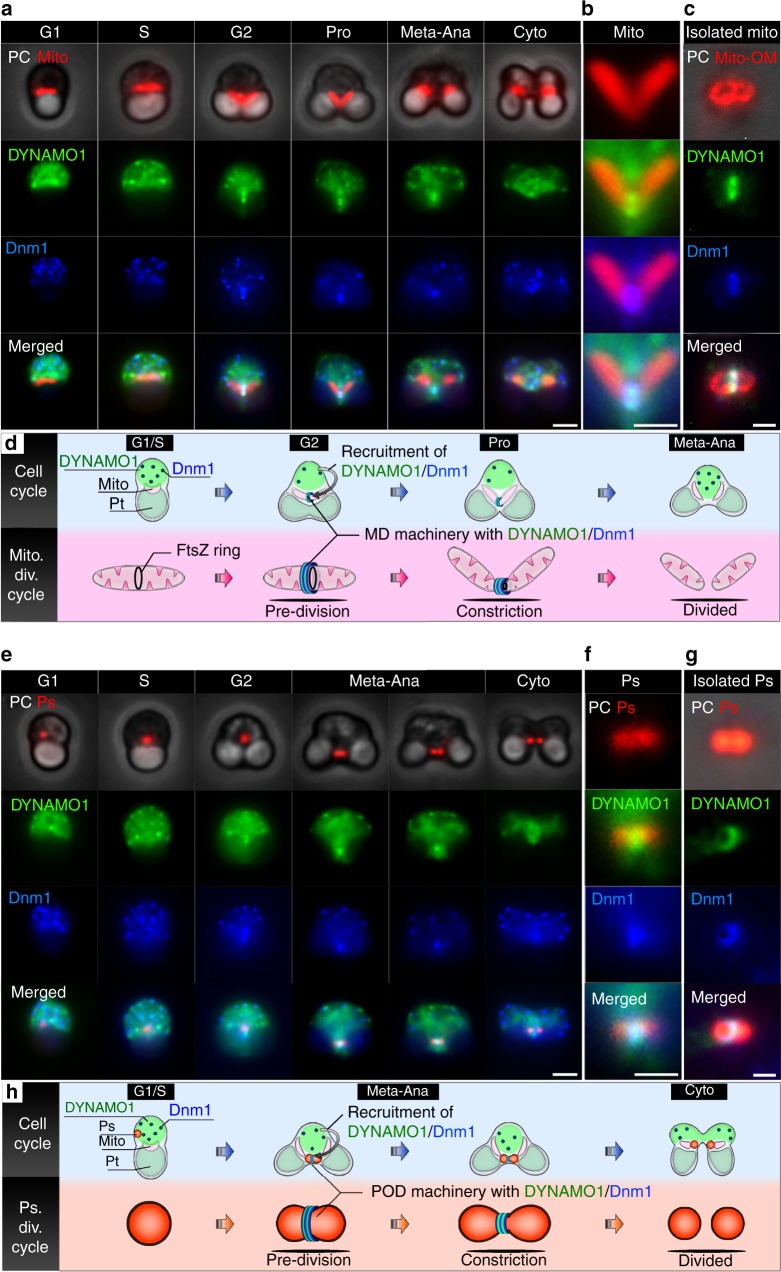
Fig. 2.
Dynamics of DYNAMO1 during the division periods of mitochondria and peroxisomes. a Phase contrast and immunofluorescence microscopy images of a mitochondrion (Mito, anti-EF-Tu antibody), DYNAMO1 (anti-DYNAMO1 antibody), and Dnm1 (anti-Dnm1 antibody) during the indicated cell cycle phases. Pro prophase, Meta–Ana metaphase–anaphase, Cyto cytokinesis. b Magnified image around the mitochondrial division site during prophase shown in a. c Localization of DYNAMO1 and Dnm1 on the isolated mitochondrial outer membrane [Mito-OM, anti-porin (POR) antibody]. d Schematic representing DYNAMO1 dynamics during the mitochondrial division period. e Phase contrast and immunofluorescence microscopy images of a peroxisome (Ps), DYNAMO1, and Dnm1 during the indicated cell cycle phases. f Magnified image around the peroxisomal division site during meta-anaphase shown in e. g Localization of DYNAMO1 and Dnm1 on an isolated dividing peroxisome. h Schematic representing DYNAMO1 dynamics during the peroxisomal division period. Scale bars: 1 μm (a, e); 500 nm (b, c, f, and g)

