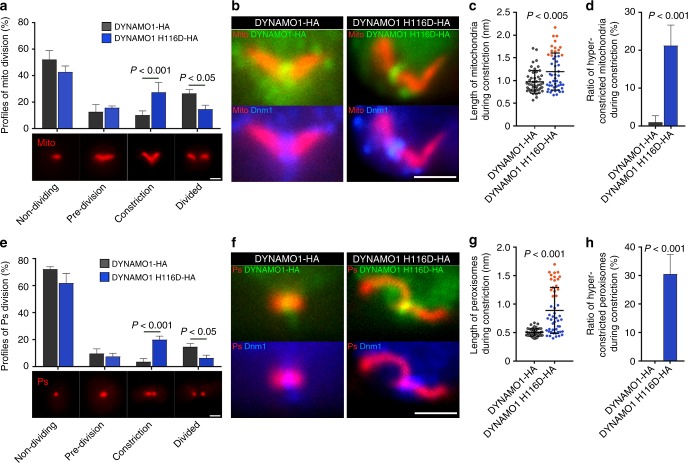
Fig. 4.
Disruption of DYNAMO1 functions and whole-mount negative-staining electron microscopy analysis of DYNAMO1-Dnm1 dynamics. a Profiles of mitochondrial division based on morphological changes during division. Mitochondria are labeled as in Fig. 2a. n = 3, at least 50 cells were counted in each experiment. b Localization of expressed DYNAMO1-HA and DYNAMO1 H116D-HA (Alexa 488-conjugated anti-HA antibody), Dnm1, and mitochondria in metaphase cells. c Length of mitochondria in cells expressing DYNAMO1-HA or DYNAMO1 H116D-HA. n = 50 in each experiment. Orange dots indicate hyper-constricted mitochondria as determined by quantification of their length that was elongated by more than 1.5 μm, which were positive for DYNAMO1 and Dnm1. d Ratio of hyper-constricted mitochondria during the constriction phase. e Profiles of peroxisomal division based on morphological changes during division. n = 3, at least 50 cells were counted in each experiment. f Localization of DYNAMO1-HA, DYNAMO1 H116D-HA, Dnm1, and peroxisomes in anaphase cells. g Lengths of peroxisomes in cells expressing DYNAMO1-HA or DYNAMO1 H116D-HA. n = 50 in each experiment. Orange dots indicate hyper-constricted peroxisomes as determined in c by quantification of their length that was elongated by more than 1 μm, which were positive for DYNAMO1 and Dnm1. h Ratio of hyper-constricted peroxisomes during the constriction phase. Scale bars: 1 μm. Data are means ± s.d. P; p-value (Mann–Whitney test)

