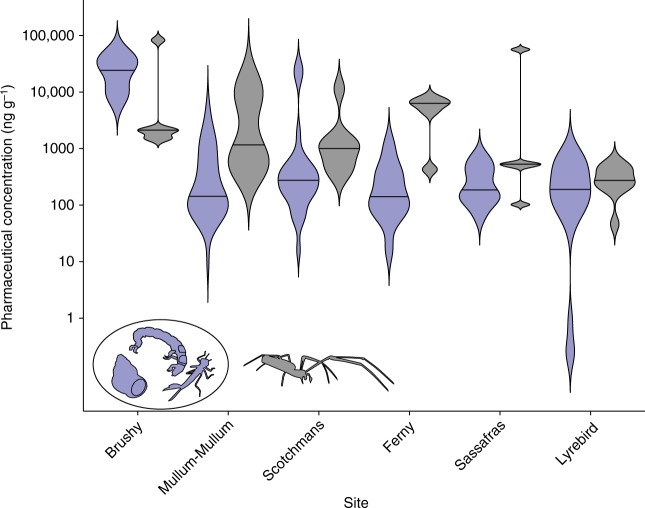
Fig. 2.
Pharmaceutical concentrations in benthic aquatic invertebrates and riparian spiders. Total pharmaceutical concentration (ng g−1 dry weight) in aquatic invertebrates (purple) and riparian web-building spiders (dark grey) for each study site, arranged in decreasing wastewater influence (indicated by δ15N in biofilms; Table 1). Violin plots illustrate kernel probability density and horizontal lines within each plot indicate median concentrations (see Methods for additional details on violin plots). The caddisfly image in this figure was adapted from Walters, D.M., M.A. Ford, and R.E. Zuellig. 2017. An open-source digital reference collection for aquatic macroinvertebrates of North America. Freshwater Science 36(4):693−697. DOI: 10.1086/694539. The spider image was adapted from a photo by Ryan R. Otter (Middle Tennessee State University)

