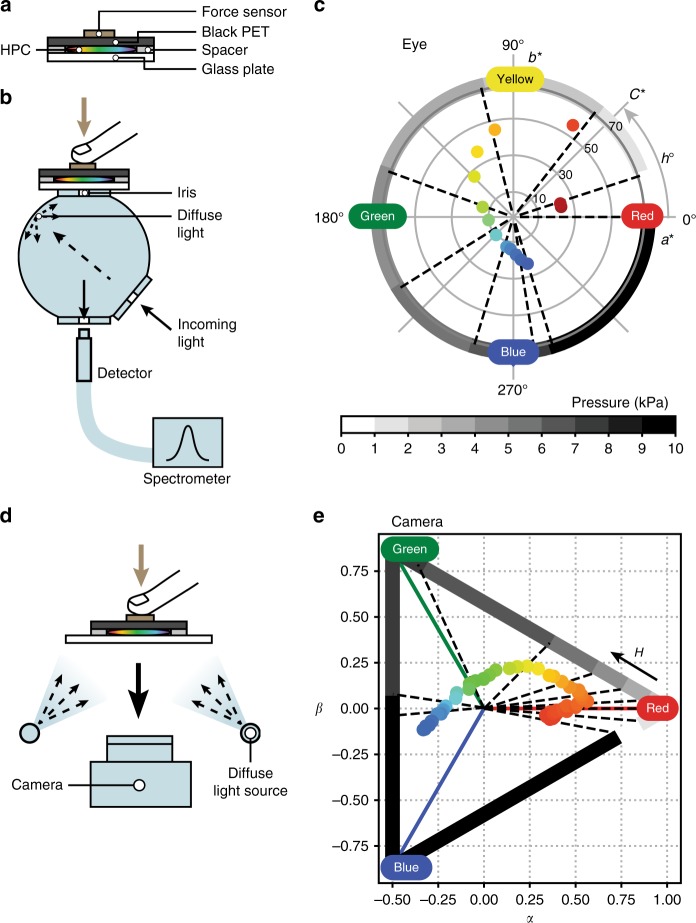
Fig. 2.
Measurements of pressure-induced colour change in HPC films with data plotted in CIELAB and RGB colour diagrams. a Sample HPC encapsulated between rigid glass plate and sheet of black PET backing, with 800 μm-thick spacers. b Set-up to measure reflection spectrum of HPC under pressure using integrating sphere with diffuse illumination and normal angle detection. Black arrows indicate light paths, iris diameter is 5 mm. c Colour diagram on a*b* plane showing colour response of HPC under a pressure sweep. Axis a* goes from green (−a*) to red (+a*), axis b* goes from blue (−b*) to yellow (+b*). In polar coordinates, each point is defined by its radius to the centre (chroma C*) and its angle (hue h°). Hue h° is mapped to applied pressure, pressure increments represented in shades of grey. d Set-up to capture colour of HPC under pressure, lit by diffuse light and with imaging device recording at normal angle. Black arrows indicate light path. e Ternary plot showing colour signal variation of HPC under a pressure sweep. Each point is defined by the relative weights of the R, G and B primaries (the vertices of the triangle). The hue H is mapped to applied pressure, pressure increments represented in shades of grey on same scale as c

