Figure 2.
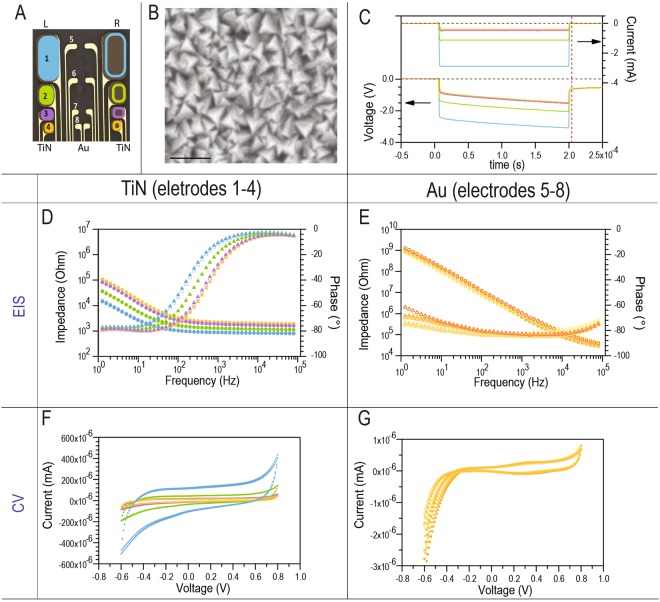
In vitro electrochemical characterization. (A) Schematic of the MSC-16 design, color-coded to correlate with the graphs, filled and open symbols represent electrodes in the left, and right side, respectively. (B) SEM of the pyramidal topography of the TiN coating, scale bar = 100 nm. (C) Voltage transients of the TiN electrodes of different sizes. Dotted lines indicate the zero values. (D,E) EIS measurements of the TiN and Au electrodes. Circles represent the impedance and triangles the phase. (F,G) shows cyclic voltammetry measurements, voltage represents the electrode potential versus a Ag/AgCl reference electrode. Top and bottom arrows in C indicate that measurements in current and voltage, respectively.

