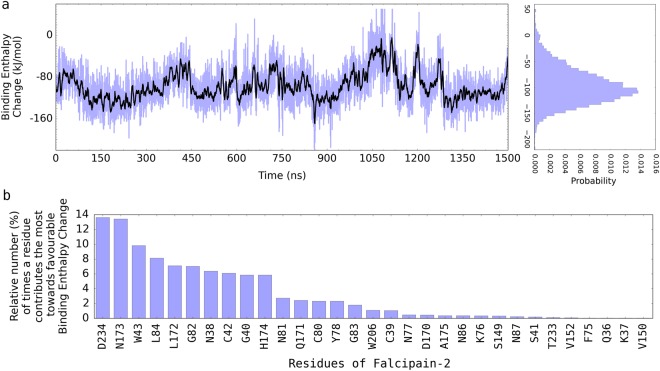
Figure 4.
FP2-E64 binding enthalpy change obtained from MM-PBSA. (a) The binding enthalpy change computed from the 1500 ns trajectory is shown in blue. Its moving average (with a sliding window of 4.0 ns) is shown in black. The MM-PBSA method is used so as to decompose the contributions of each of the residues to the overall E64-FP2 binding enthalpy. Since the entropic (TΔS = −21.42 ± 1.62) component of the ΔG from MM-PBSA could not be decomposed into residue-level (i.e. residue by residue) contributions, we show only the enthalpic (ΔH) component of the ΔG in this figure which is used for comparing the relative contributions of the residues to the ΔH. The higher magnitude of the binding enthalpy or binding energy (if the effect of entropy, TΔS, is included) obtained from the MM-PBSA (compared to the results obtained from the ABMD calculations) is a known issue32,35,36 but does not affect the assessment of the relative contributions of each of the residues which is the sole purpose for which this method is used in this study. (b) A list of the residues contributing the most towards the favourable binding of E64 to FP2 are shown in (b).

