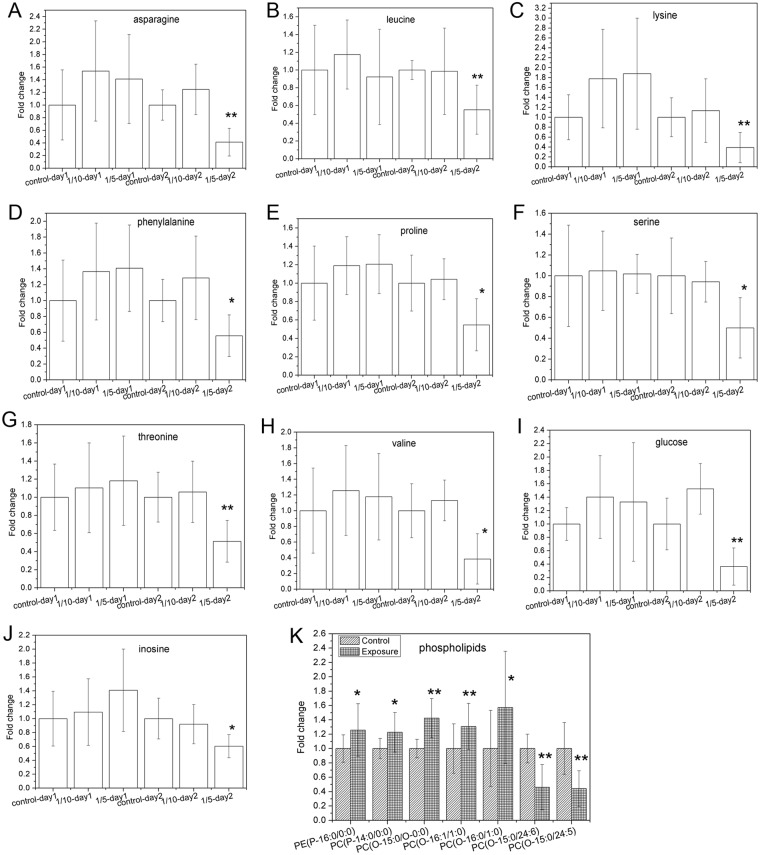
Figure 4.
Fold changes of differentiated metabolites after acute TPHP expousre: (A) asparagine, (B) leucine, (C) lysine, (D) phenylalanine, (E) proline, (F) serine, (G) threonine, (H) valine, (I) glucoside, (J) inosine and (K) phospholipids. For A-J, fold changes were calculated by dividing the peak areas of the exposure groups with the mean peak area of the control group for the same day from the GC-MS chromatograms. For phospholipids, control group, “Control” refers to control-day 1 and day 2 samples, whereas “Exposure” refers to the pool of the rest of the samples, and fold changes were calculated by dividing peak area in “Exposure” with mean peak area in “Control”. Data are shown as mean ± standard deviation. Significantly different levels compared with related control are labeled with an asterisk (at P < 0.05) or two asterisks (at P < 0.01) based on a two-tailed student t-test.

