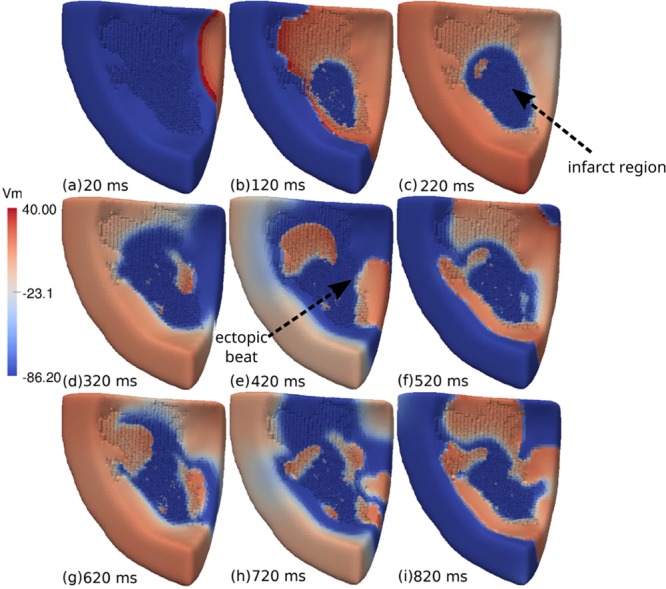
Figure 6.

Visualization of the transmembrane potential of one of the simulations performed during Monte Carlo analysis using the ventricular wedge containing a large scar. This is one of the observed sustained reentries with ϕ = 0.66 and [ATPi] = 2 mM. (a) A single stimulus is applied at the upper-right region of the wedge. (b) The AP wave propagates towards the left of the LV wedge. Inside the infarct region we observe some electrical activity due to a fractionated propagation that occurs in the maze formed by non-conducting fibrosis and conducting myocytes. (c) The LV wedge is fully depolarized. Micro-reentries lead to the formation of a fractionated spiral wave inside the infarct region. (d) The LV wedge begins to repolarize. An AP wave begins to leave the infarct region at its right side. (e) An ectopic beat is generated at the right side of the infarct region and propagates towards the healthy tissue. Another ectopic beat leaves the infarct region on the top and enters the peri-infarct zone region. (f) The LV wedge begins to depolarize again. Inside the infarct region, micro-reentries persist. (g) Another AP wave begins to leave the infarct region at the right side of the infarct region. (h) A second ectopic beat is generated at the right side of the infarct region and propagates towards the healthy tissue. (i) A complex pattern of AP waves is formed via the interaction between micro-reentries inside the infarct region and AP propagation in the healthy tissue.
