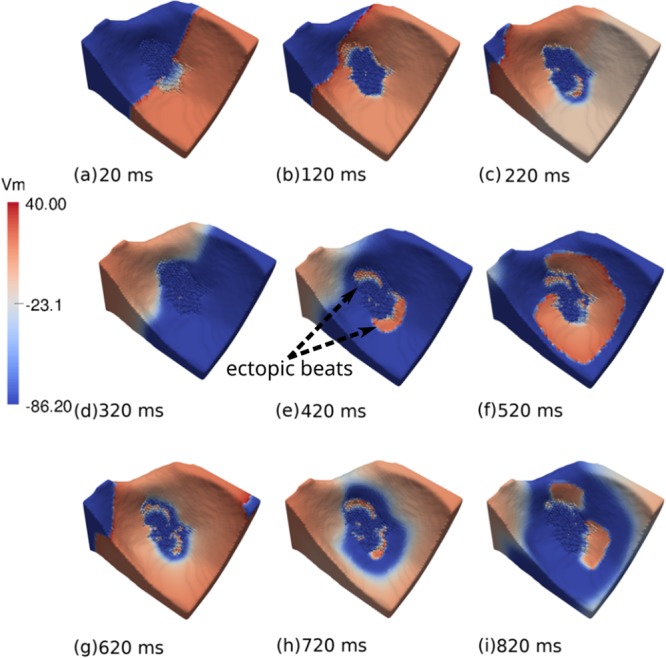
Figure 7.

Visualization of the transmembrane potential of one of the simulations performed during Monte Carlo analysis using the ventricular wedge containing the small scar. This is one of the observed sustained reentries with ϕ = 0.66 and [ATPi] = 2 mM. (a) A single stimulus is applied at the right region of the wedge. (b) The AP wave propagates towards the left of the LV wedge. (c) The LV wedge is almost fully depolarized. Micro-reentries lead to the formation of a fractionated figure-of-eight pattern inside the infarct region. (d) The LV wedge begins to repolarize. (e) Two ectopic beats simultaneously leave the infarct region and re-excite the healthy tissue. (f and g) The LV wedge begins to depolarize again. Inside the infarct region a fractionated figure-of-eight pattern persists (h). Healthy tissue repolarizes. (i) The sustained fractionated figure-of-eight pattern re-excites the tissue again.
