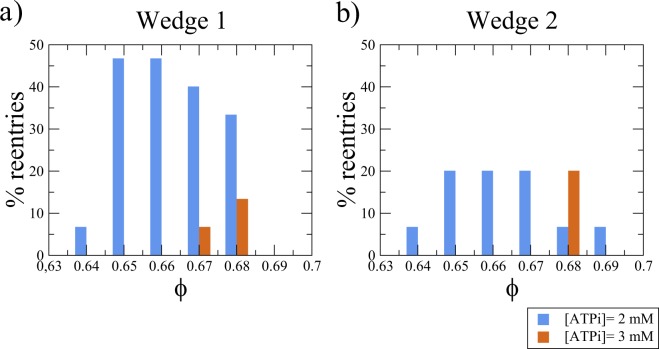
Figure 8.
Results obtained from Monte Carlo simulations of the ventricular wedges by varying the percentage of fibrosis, (ϕ), and the degree of ischemia in the infarct region ([ATPi]). For each fixed value of ϕ, 20 different realizations are generated and simulated, each one with a different topological structure of the fibrotic network. The blue bars show the percentage of sustained reentries observed for different values of ϕ with [ATPi] = 2 mM. The orange bars show the number of sustained reentries obtained for different values of ϕ with [ATPi] = 3 mM. Reentries are found for values of ϕ near the theoretical limit for the percolation threshold, which is equal to 0.68.

