
Figure 9.
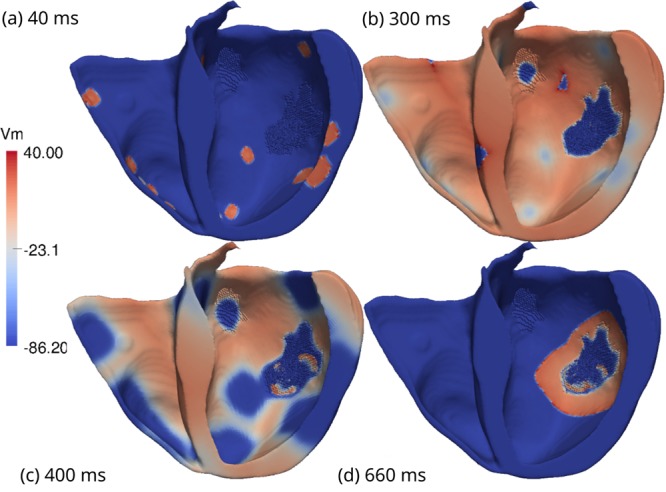
Visualization of the transmembrane potential of one of the simulations performed using the biventricular patient-specific mesh (to facilitate the visualization only half of the ventricles is shown in the figure). The simulation presents sustained reentries with ϕ = 0.66 and [ATPi] = 2 mM. (a) Multiple stimuli were applied to different subendocardial regions to mimic an activation via the Purkinje network. (b) Both ventricles are fully depolarized. No electrical activity inside the small infarct region at the upper region of the LV is found. This behavior holds during the entire simulation. However, inside the larger infarct region we observe persistent electrical activity due to the fractionated propagation of AP waves. (c) The ventricles begin to repolarize. Inside the large infarct region micro-reentries lead to the formation of two fractionated spiral waves. (d) An ectopic beat is generated at the right side of the large infarct region and propagates towards the healthy tissue.