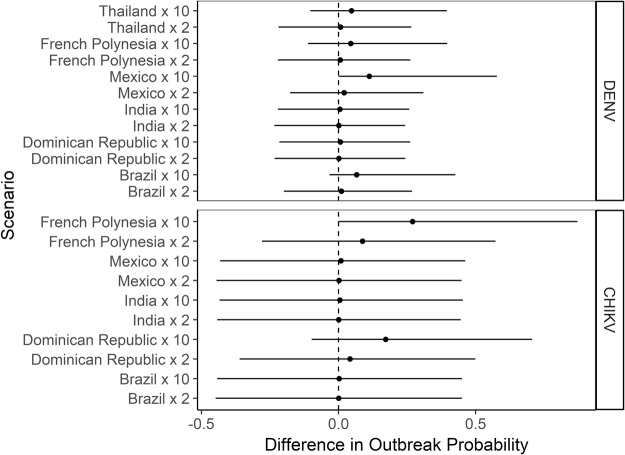
Figure 5.
Yearly cumulative outbreak probability for Dengue (DENV) and Chikungunya (CHIKV) viruses in Rome in the case of HBR = 1. Differences in outbreak probability are shown considering 2012–2015 incident cases worldwide as baseline and comparing them with increasing epidemics (x2, x10) in selected countries. Dots represent the mean difference between baseline and scenario; solid horizontal lines represent the 95% credible interval of the difference distributions. The dashed vertical line indicates no difference.

