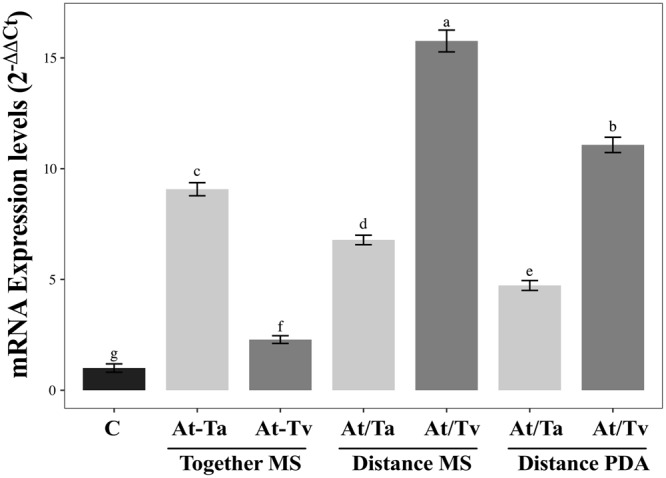
Figure 6.

Analysis of A. thaliana ERD14 expression levels in interaction with Trichoderma strains. qRT-PCR was performed on the different interactions at 6 h under 12 °C. Normalized fold change was calculated by comparing the ERD14 gene expression level with a control (un-inoculated) after normalization to the Arabidopsis UBQ5 gene using the (2−ΔΔCt) method. Three biological replicates were analyzed with their respective technical replicates. Barplots present mean ± SD values of dependent variables according to our experimental treatments. Letters refer to bootstrap pairwise two-sample robust tests, treatments without shared letters are significantly different.
