
Figure 3.
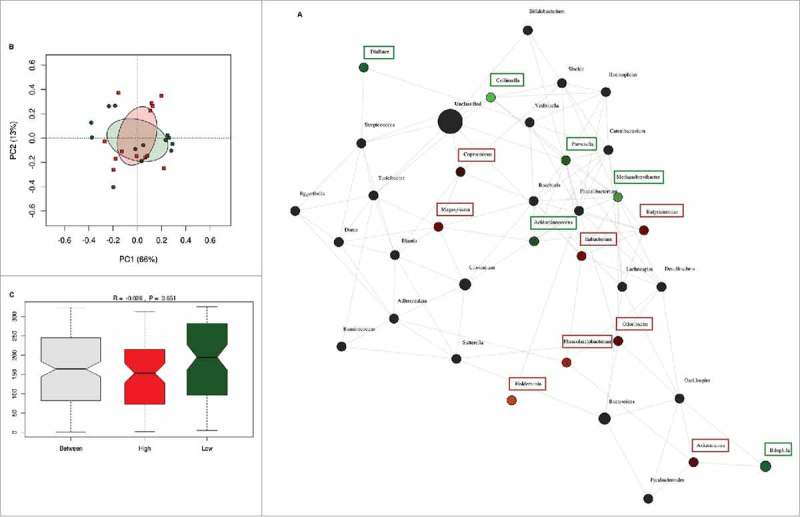
Differences in microbiota composition according to high and low fiber intake. (A) Network analysis based on high (n = 13) and low (n = 13) dietary fiber intake. Genera are represented as nodes. Green nodes represent genera overrepresented in the low-fiber group. Red nodes represent genera overrepresented in the high-fiber group. Color intensity explains the strength of the associations with fiber intake. (B) Principal component analysis showing the clustering of selected samples based on high (red) and low (green) fiber intake. (C) Identification of significant associations between low and high dietary fiber groups by Anosim test.