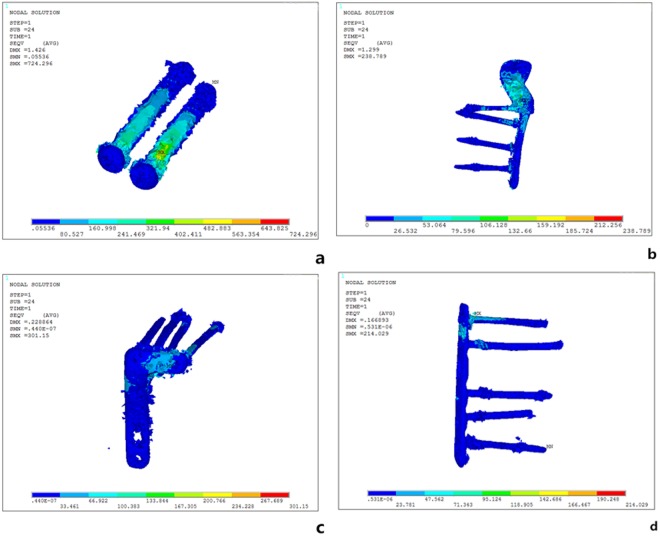
Figure 7.
Stress Distribution of the Four Groups Under an Axial Load of 250 N. (a) Group A: the stress was mainly focused on tail closing to the end cap; (b) Group B: the stress was mainly focused on the junction of the oblique and straight portions and the two proximal screws. (c) Group C: the stress distribution was more uniform, with the increase found on local areas of the head’s side and corner and on the screw located most posteriorly. (d) Group D: the stress was mainly focused on the tails of two proximal screws and the local area of the plate between them.

