Abstract
Dual-energy micro-Computed Tomography provides high resolution non-invasive images at low cost. It can determine the concentrations of component materials in a mixture. Taking the advantages of K-edge, the gold-based agents contribute to improve the contrast of some physiological tissues with low natural contrast. Because the K-edge of gold (80.7 kVp) is excessively high, the anatomical structures could not be identified clearly in in vivo small animal experiments. In this study, the energy combination below K-edge is optimized to differentiate bone, soft tissue and gold. Furthermore, we evaluate the effects of concentration of contrast agents, the extrinsic filtration setting and dose level. Based on the quantitative analysis results of material decomposition, the optimized energy pair gathered in a certain range where the low-energy is 30kVp-40kVp. Our results can provide a practical guidance for the design of in vivo small animal experiments using gold-based contrast agents.
Index Terms: Dual-energy mirco-CT, material decomposition, gold-based contrast agents, energy combination
I. Introduction
Micro-computed tomography (micro-CT) is an efficient and widely accepted tool for preclinical research, and it has been extensively used in non-invasive small animal experiments[1]. The development of exogenous contrast agents contributes to highlighting physiological features with low natural contrast in micro-CT images [2]. In 2006, as new and promising x-ray contrast agents, the Gold (Au) nanoparticles were used in in vivo experiments[3]. As an effective experimental x-ray contrast agent, gold has been reported to overcome many obstacles of traditional iodine-based contrast agents [4]. Compared with the well-known iodine, gold averagely provides about 2.7 times greater contrast per unit weight in the energy range 0 to 100 keV due to its high atomic number and high photoelectric photon absorption [3]. Gold also takes advantages of its low toxicity and biocompatibility[5]. However, the effectiveness of gold as a contrast agent depends on not only their physical properties, but also the scanning conditions. X-ray tube voltage is a major determinant of contrast. Gold absorbs x-rays strongly in the range of 80-120keV since its K-edge is at 80.7 keV. Hence, it can provide greater contrast when it is scanned at 120kV and 80kV [6]. Despite of the advancements in new contrast agents, it is still difficult to segment images only based on grey-scale signal intensity because different materials may share similar grey-scale intensity values in single-energy CT images. As a result, the dual-energy CT imaging (DECT) was developed, where an object is scanned using two energy spectra with different voltage settings. The main advantage of DECT over the conventional CT is the photon energy dependence of the linear attenuation coefficients. Due to the incorporation of K-edge, DECT images can be decomposed into different material specific images [7]. DECT also has a capability to determine the concentration of component materials in mixture. The obtained basis material images depend on the linear attenuation coefficients and dual-energy projection data acquisition[8]. Material decomposition can be performed either in projection-domain [9] or in image-domain [10–13]. In image-domain, the linear attenuation coefficients obtained from the reconstructed images at low- and high-energies are expressed as a linear combination of the pixel values in the images of the two basis materials [10]. Thus, basis material images can be simply generated using a matrix inversion.
Although it is expected that the energy above K-edge of gold is the optimal option, it can’t be applied in some small animal experiments since the anatomic structures of small animals are not clearly visible at such a high energy level. A previous study showed that micro-CT imaging at 40kVp and 80kVp are optimized energy pair to differentiate iodine and gold-based nanoparticles [11]. To extend this work, in this paper we design and perform a series of numerical simulations. The aim is to find the optimal energy combination below K-edge for material decomposition and investigate the effects of various concentrations of gold-based contrast agents and other physical parameters, such as the extrinsic filtrations and various dose levels. Here, we implement a matrix inversion algorithm [12] for material decomposition to obtain three basis material images. This method can be implemented easily but will introduce some unexpected noise during the process of decomposition. Furthermore, a HYPR-NLM (local highly constrained backprojection reconstruction non-local mean) algorithm [8] is employed for noise suppression. The rest of the paper is organized as follows. The next section describes the dual-energy material decomposition algorithm, noise suppression algorithm, and the experimental design of numerical simulations. The third section presents numerical simulation results. The last section discusses some contributions and related issues, and makes a conclusion for this paper.
II. Methods
A. Material Decomposition and Noise Supression
In this study, we implement the algorithm developed by Vinegar and Wellington [13] to generate independent images of bone, soft tissue and gold. The algorithm is designed for a three-phase system, and at least two independent measurements are needed to determine the fractions. For each voxel of a CT image, the effective linear attenuation coefficient (μ) could be expressed as a linear combination of the attenuation coefficients of basis materials multiplied by their corresponding volume fraction
| (1) |
where μB,E, μST,E,μAu,E are the effective linear attenuation coefficients acquired at a mean x-ray energy E of bone, soft tissue, and the solution of gold, respectively, and fB, fST and fAurepresent the corresponding volume fractions. If a voxel contains only three basis materials, the sum of these volume fractions must be equal to 1.
| (2) |
For two CT images reconstructed at the mean energies E1 and E2, we have two independent measurements of the attenuation coefficients:
| (3) |
| (4) |
The linear attenuation coefficients of basis materials at different energies can be measured from the CT images within known regions only containing the corresponding basis materials. As a result, three unknowns fB, fST, and fAu could be solved. In our implementation, we assume that the percentage concentration of each of three basis materials (fractions) must be non-negative and voxels with the linear attenuation coefficients below soft tissue (i.e., air-containing regions) contain no basis materials.
The matrix inversion decomposition algorithm (2)–(4) could greatly amplify noise, and the noise suppression is the main objective to be addressed in image-domain material decomposition. To improve the decomposition precision and the similarity of material specific image comparing with the corresponding reference image, we employ the HYPR-NLM algorithm (local Highly constrained backPRojection reconstruction Non-Local Mean) [8]to reduce the amplified image noise in the decomposed material-specific images directly. The HYPR-NLM algorithm is based on the HYPR-LR (Local HighlY constrained backPRojection Reconstruction) framework which treats the energy dimension of CT images as time dimension. In this framework, a denoised image is equal to a weight image multiplied by a composite image. The composite image is generated by averaging the energy images with equal weighting. We assume that the composite image has lower image noise level than the original energy images. Here, the energy images can be high- and low-energy images of dual-energy CT or multiple energy bins of photon-counting detector CT images. The mathematical formula of HYPR-LR algorithm is as follow,
| (5) |
where is the denoised material-specific image, is the material-specific image, and is the composite image. The symbol ⊗ represents convolution operation. The weight image is equal to the ratio of two filtered images and K is a uniform low-pass filter kernel.
The HYPR-NLM algorithm introduces an edge-preserving non-local mean (NLM) to substitute a low-pass filter kernel. The non-local mean is a robust algorithm to compare both the grey level in a single point and the geometrical configuration in a whole neighborhood[8]. Inside a denoised material specific image, a pixel i can be calculated as
| (6) |
where the weight ω (i, j) represents the similarity between the pixels i and j, and it satisfies the constraint conditions 0≤ ω (i, j) ≤ 1 and . The pixel dependent summation domain Ωi denotes a search-window centered at the pixel i and it usually is a square neighborhood with a fixed size. The weight is constructed as follow
| (7) |
where Ni is a square neighborhood of fixed size and centered at a pixel i (referred to as the similarity window),x (Ni) denotes the vector of pixel values within the similarity window, and Z (i)is the normalizing factor.
| (8) |
where the parameter h controls the degree of filtering.
In the non-local mean denoising part, the weight decay control parameter h directly affects the image quality. To select a proper parameter, it is crucial to estimate noise level. In this work, we assume that the high-frequency components of an image are noise, a filter-based method [14] is employed to calculate the average standard derivation of noise and h. The smoothing parameter is the same for all the simulations in this study.
The accuracy of the dual energy decomposition is evaluated by the relative root mean square error (rRMSE) and peak signal-to-noise ratio (PSNR). The rRMSE is a classic difference-based metric. Each value represents the differences between the expected values and the obtained values from experiments. The rRMSE is calculated for bone, soft tissue and gold images, respectively. For a material-specific image, the rRMSE is computed as follow:
| (9) |
where fB,i is the value of the ith pixel in the basis material image decomposed from the reconstructed images with noise, fE,i is the value of the ith pixel in the basis material image decomposed from the ground-truth data obtained from the numerical phantom, and N is the total number of pixels in the basis material image. The PSNR approximates human perception of reconstruction quality. For a material-specific image, the PSNR is calculated as follows:
| (10) |
where MAXI represents the maximum possible intensity of the image, and MSE is written as:
| (11) |
where fB,i, fE,i and N are the same as defined in (9).
B. Experimental Design
In the numerical study, we apply a realistic mouse thorax phantom generated by the MOBY software (Fig. 1). The diameter of this phantom is about 30.0 mm. The gold-based contrast agent is superimposed to the blood circulation system (Fig. 1). An ROI (region of interest) would be used to calculate rRMSE and PSNR. In the first two experiments (the effect of HYPR-NLM and the optimal energy combination), the concentration of gold-based contrast agent is 16mg/ml. The linear attenuation coefficient of the gold-based contrast is calculated using the mixture rule. The corresponding values of linear attenuation coefficients are obtained from the National Institute of Standards and Technology (NIST) database. The x-ray spectra are significantly influenced by kVp, target material and filtration [13]. The x-ray spectra are obtained from Siemens [16]. The simulated x-ray source includes tungsten. To get more practical results in the material decomposition, the extrinsic Aluminum (Al) filtrations with different thickness are used under low- and high-energy spectra. This will increase the mean energy of the high-energy spectrum to be as high as possible and provide adequate photon flux [12].
Fig. 1.
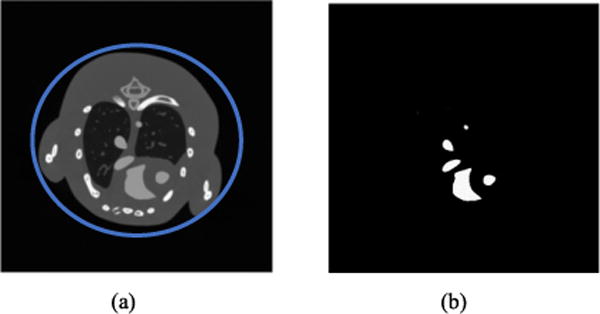
(a) The 2D mouse thorax phantom (the ROI is encircled by blue ring) and (b) the gold-based contrast agent distribution for numerical simulations.
The mouse phantom is virtually irradiated to generate projections at each keV for a given spectrum based on Beer’s law. The final pre-log projection is a weighted sum of projections at all keV and the weighting coefficients are the normalized flux shown in Fig. 2 (a). To determine the optimal x-ray tube potential energies (below the K-edge of Au) of dual energy decomposition, the projections are generated assuming a series of spectra starting from 30kVp and ending at 80kVp with a step of 5 kVp. Here, 30 kVp is the lowest scanning energy that could be obtained from Siemens website [16]. The normalized flux is obtained when the thickness of the Al filtrations is 2.0 mm for low-energy spectra (30kVp, 35kVp, 40kVp, 45kVp, 50kVp) and 3.5 mm for high-energy spectra (55kVp, 60Vp, 65kVp, 70kVp, 75kVp, 80kVp). In our experiments, 2D fan-beam CT geometry is assumed. The distance from the source to the rotation center is 351mm, the distance from the source to the detector is 541 mm, a circular scan is simulated, and 720 projections are uniformly acquired over a full scan range. The detector pixel size is 0.078 mm and the detector includes 1024 pixels.
Fig. 2.
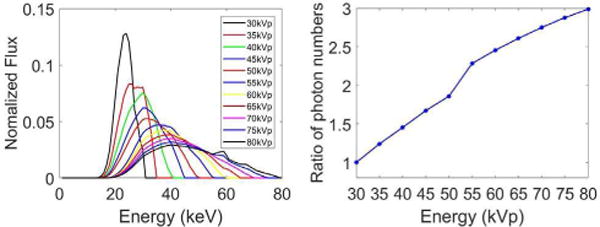
(a) Normalized x-ray spectra for different voltages (30kVp to 80kVp, increment: 5kVp) used in numerical simulation; and (b) the ratio of the number of photons with each energy spectrum to that with 30kVp spectrum.
To be realistic, Poisson noise is superimposed into the projections [15]. The total number of photons for each projection with 30kVp spectrum is 4×10⁵ and the ratio of the number of photons with other energy spectrum is shown in Fig. 2(b). The ratio of the photon number is equal to photon fluence density (photon fluence/mm2) ratio obtained from Siemens website [16]. For all the numerical simulations in this work, the final air kerma are the same. A conventional filtered backprojection algorithm is employed for image reconstruction. The dual energy material decomposition and noise suppression in II. A are performed on the reconstructed images. We evaluate all the possible combinations between 30kVp and 80kVp.
C. Effect of Contrast Agent Concentration
In addition to the x-ray spectrum kVp, the concentration of contrast agent is another important determinant for attenuation. To investigate whether the concentrations of contrast agents affect the optimal voltage pair(s), we repeat the numerical simulations in II.B with different concentration levels: 2mg/ml, 4mg/ml, 8mg/ml, and 32mg/ml, and the rest of the parameters are the same as those in II.B. Taking the 40kVp image as an example (Fig. 3), the concentrations obviously affect the x-ray linear attenuation coefficients.
Fig. 3.
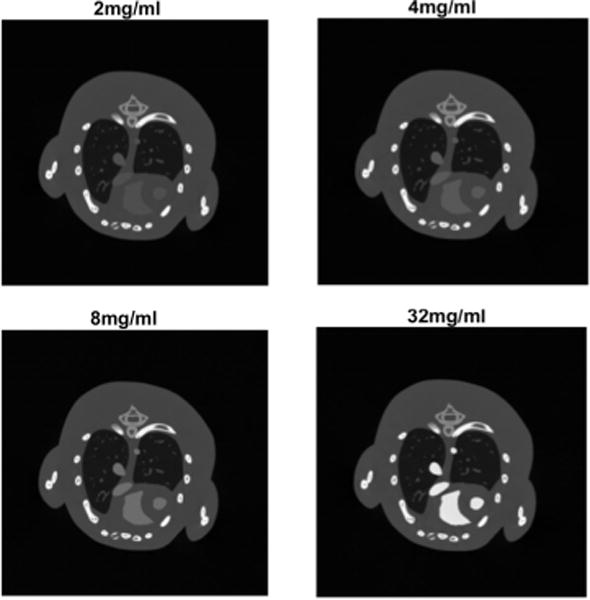
Phantom images at 40kVp with different concentrations of gold-based contrast agents.
D. Effect of Filtration
As the aforementioned in II.B, the extrinsic filtration also has significant impacts on the x-ray spectrum. To study the effect of filtration, we fix the energy pair and contrast agents which correspond to the optimal decomposition results in II.B, and the experiments are repeated with six various thicknesses groups of Al filtration for low- and high-energy scanning (H/L=1.0/1.0, 2.0/2.0, 2.0/1.0, 3.0/2.0, 3.5/1.5, 3.0/1.0, unit: mm), respectively. The photon number under low-energy spectrum is 4×10⁵ for all groups, and other parameters of those groups are summarized in table 1.
TABLE I.
Summary of physical parameters for all groups of simulations
| the Energy of Spectra Peak (KeV) after A1 Filtration | Ratio of Photon Numbers(H/L) | ||
|---|---|---|---|
| Low Energy | High Energy | ||
| Group 1 | 28 (1.0 mm) | 31 (1.0 mm) | 2.2:1 |
| Group 2 | 30 (2.0 mm) | 35 (2.0 mm) | 2.2:1 |
| Group 3 | 28 (1.0 mm) | 35 (2.0 mm) | 2.4:1 |
| Group 4 | 30 (2.0 mm) | 37 (3.0 mm) | 2.5:1 |
| Group 5 | 30 (1.5 mm) | 38 (3.5 mm) | 2.5:1 |
| Group 6 | 28 (1.0 mm) | 37 (3.0 mm) | 2.6:1 |
E. Effect of dose level
To determine the variation of decomposition accuracy across different noise levels, for a time consumption concern, we only select a fixed low energy at 40kVp and vary high energy from 60kVp to 80kVp. Here, the Al filtrations are 2mm for 40kVp scan and 3.5 mm for high-energy scans (60Vp, 65kVp, 70kVp, 75kVp, 80kVp). In our numerical phantom studies, five groups of photon numbers are used for low-energy scans (NL): 5×10⁴, 1×10⁵, 2×10⁵, 8×10⁵, 1.6×10⁶. The ratio of photon Numbers (H/L) is 2:1, and the concentration of gold is 16mg/ml.
III. Results
A. Noise Supprssion
This study applies the HYPR-NLM algorithm to suppress noise. For each combination of high- and low- energy images, we estimate the noise levels of the composite image and material specific images, respectively. For the bone and soft tissue images, we use a non-iterative HYPR-NLM formulation, and the noise magnitude is slightly reduced. For the gold image, we use an iterative-HYPR-NLM with two iterations. The parameters of the HYPR-NLM are the same for all the images, and the search window size is 11 × 11 and the kernel size is 5 × 5.
Fig. 4 shows the influence of HYPR-NLM noise suppression on the accuracies of material specific images. In the PSNR (rRMSE) plots, the height of each bar represents the average PSNR (rRMSE) values among all energy combinations. The results of these two metrics are consistent. That is, the HYPR-NLM could significantly improve the accuracies of the decomposed bone, soft tissue and gold images.
Fig. 4.
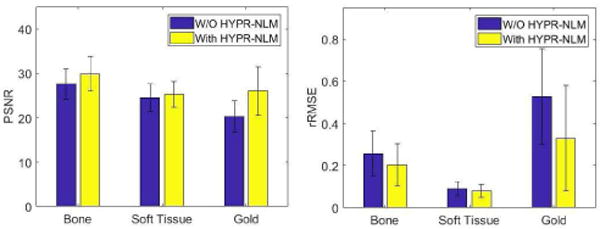
The PSNR and rRMSE values of bone, soft tissue and gold images with and without the HYPR-NLM.
To demonstrate the effect of the HYPR-NLM noise suppression, we choose the reconstructed images at 40kVp and 65kVp to study. Fig. 5 shows the denoised material specific HYPR-NLM results, as well as the reference and original material specific images decomposed from the same images. The first row consists of bone, soft tissue and gold reference images which are generated by decomposing noise-free dual-energy images. The second row consists of three material specific images without noise suppression. The third-row images are the material specific with noise suppression.
Fig. 5.
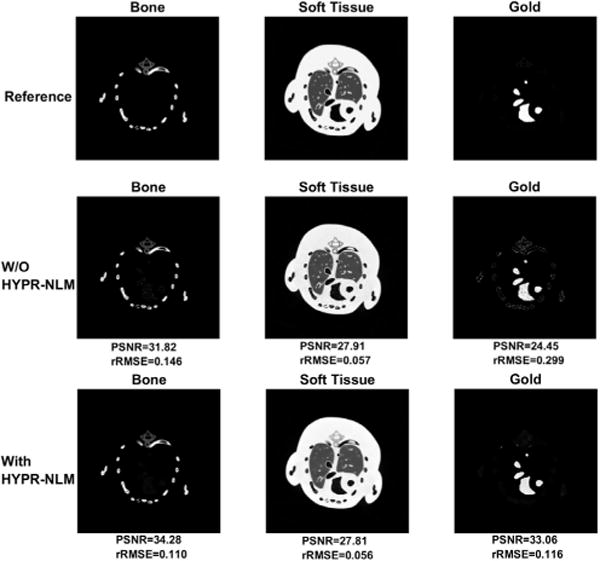
Illustration of material specific images before and after the HYPR-NLM noise suppression.
B. The Optimal Energy Combination
The criteria to evaluate energy combination are based on the PSNR and rRMSE. The energy combination results the lowest rRMSE or the highest PSNR is considered as optimal. In this subsection, the bone, soft tissue and 16 mg/ml gold solution are selected as the basis materials for dual-energy material decomposition. We evaluate all the possible combinations between 30kVp and 80kVp, and calculate the PSNR and rRMSE for each material specific image, respectively.
In the first row of Fig. 6, each PSNR matrix illustrates results for one basis material under all energy combinations between 30kVp and 80kVp. In each matrix, rows represent the high-energy group, from 45kVp and 80kVp (increment is 5kVp), and columns represent the low-energy group, from 30kVp and 65kVp (same increment). The energy combination with the low-energy scanning at 30kVp, 35kVp and 40kVp and the high-energy scanning at 55kVp to 75kVp are better than other combinations since their corresponding PSNR values are higher. Based on the PSNR results, one can see that the highest values are not identical in bone, soft tissue and gold images (red ring). However, among all possible energy combinations, the ranges of PSNRs in gold images are the widest. This implies that various energy combinations have the greatest influence on the accuracies of gold images. When the optimal energy combinations of bone, soft tissue and gold images are not consistent, the accuracy of gold images could be considered as primary. Therefore, the energy combination under the scanning voltages 40kVp and 65kVp is considered as the optimal choice. The second row in Fig. 6 consists of rRMSE matrixes of material special images and the results of rRMSE are consistent with those of PSNR.
Fig. 6.
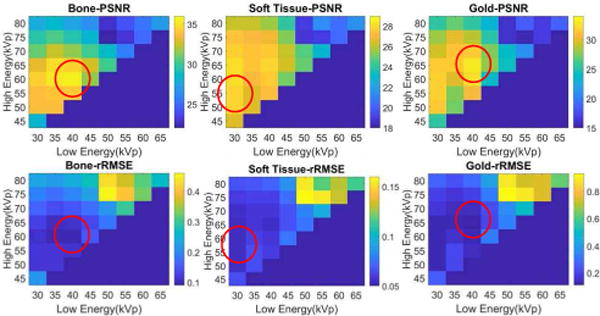
The PSNR and rRMSE values for all possible combinations of energies. The minimum difference of two energies is 3 increments and each increment is 5kVp. Each figure showed the PSNR (or rRMSE) values of bone, soft tissue and gold images, respectively.
Fig. 7 shows the dual-energy material decomposition results of reconstructed images at 40kVp and 65kVp and their corresponding PSNR and rRMSE. Fig. 8 shows the best and the worst decomposition results which exhibit the significance of energy combination intuitively. Although the optimal energy combination is selected, the best gold image still has some visible errors as indicated by the arrow.
Fig. 7.
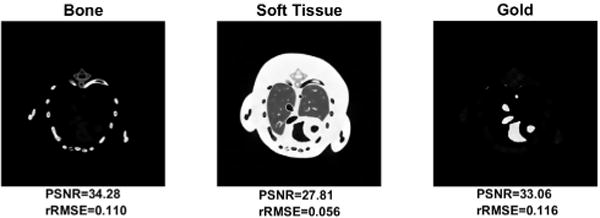
Dual-energy decomposition of the reconstructed Moby phantom images at 40kVp and 65kVp.
Fig. 8.

The gold images decomposed from reconstructed images at the best energy combination and the worst energy combination. Errors were indicated by a red arrow.
C. Effect of Contrast Agent Concentration
Fig. 9 shows the PSNR matrixes for each material specific image for four different gold concentration levels. The matrices in each row depict the material specific images decomposed from the reconstructed phantom images with a given contrast agent concentration. The optimal energy combination varies with respect to different gold concentrations. For the gold images, energy combinations with higher PSNRs gather in a region where the low-energy is set between 30kVp and 40kVp and the high-energy is set between 55kVp and 75kVp. Totally, there are fifteen energy combinations in this region, and we name it as the ‘key region’.
Fig. 9.
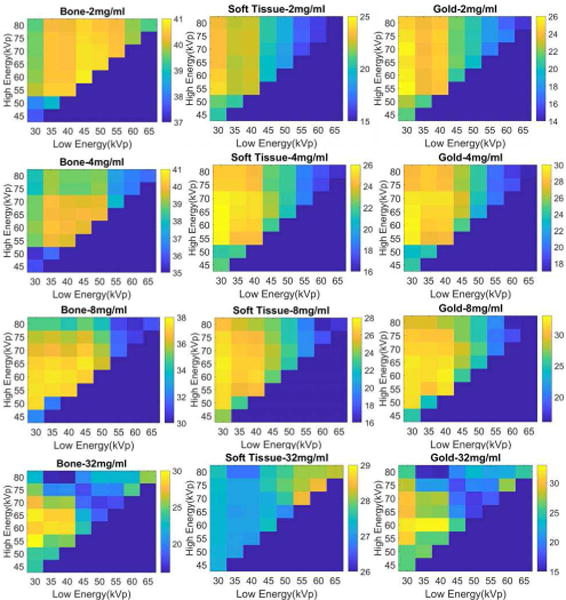
The PSNR matrixes for four different concentrations of gold contrast agents: 2mg/ml, 4mg/ml, 8mg/ml, 32mg/ml.
To analyze the tendency of accuracy with respect to the gold solution concentration, we compare the average PSNR and rRMSE values of material specific images in the ‘key region’ among five different gold solution concentrations (2mg/ml, 4mg/ml, 8mg/ml, 16mg/ml, 32mg/ml). Fig. 10 shows the one-way ANOVA (Analysis of variance, p<0.01) results for each basis material. Here, the only one factor is the concentration of contrast agents. In the ‘PSNR’ plot (left), the accuracies of bone images decrease with respect to the increased concentration of contrast agents. The accuracies of soft tissue images have opposite trend and the results of 16mg/ml and 32mg/ml are almost the same. Same as the above, the rRMSEs of material specific images are consistent with the PSNR results.
Fig. 10.
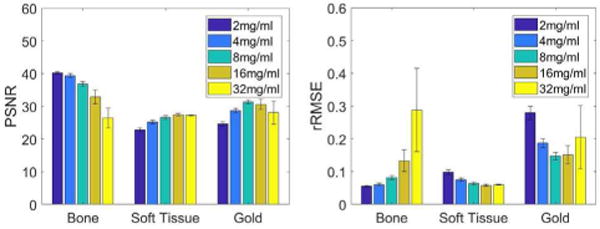
The PSNR and rRMSE values of material specific images with different concentrations of gold solutions.
D. Effect of Extrinsic Alumiunium Filtration
In this section, we divide the original six groups of filtrations settings in Table 1 in II.D for low- and high- energy scans into two categories. Category A consists of groups 2, 4 and 5 (H/L=2.0/2.0, 3.0/2.0, and 3.5/1.5), and Category B consists of groups 1,3 and 6 (H/L=1.0/1.0, 2.0/1.0, and 3.0/1.0). Here, H/L=2.0/3.0 means the filtration thickness for high- and low-energy are 2.0 and 3.0 mm, respectively. The filtrations for low-energy and high-energy scans in Category A are thicker than Category B. Based on the previous simulation results in III.B and III.C, we fix the concentration of contrast agents 8mg/ml and the corresponding energy combination 40kVp and 60kVp. Fig. 11 shows the PSNR and rRMSE values with respect to different filtration thicknesses of low-energy scans. The difference of the filtration thicknesses of low- and high-energy scans doesn’t significantly affect these two metrics.
Fig. 11.
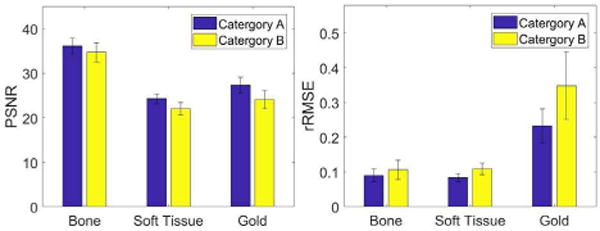
The PSNR and rRMSE for Category A and Category B.
E. Effect of Dose Level
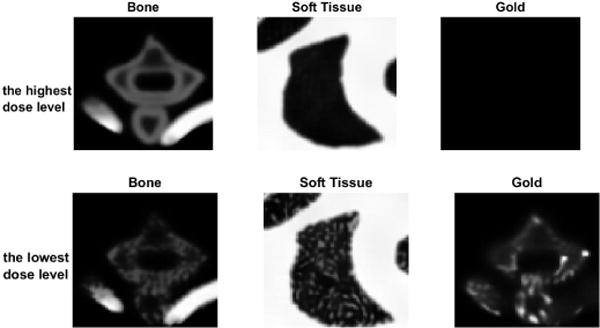
As what it is expected, the PSNRs increase with the increased dose level, and the rRMSE shows consistent results (see Fig. 12). Fig. 13 is the material specific images decomposed from dual-energy images with the lowest dose level and the highest dose level. Obviously, the dose level significantly affects the decomposition accuracy of material specific images, especially in the red square region magnified in Fig. 14.
Fig. 12.
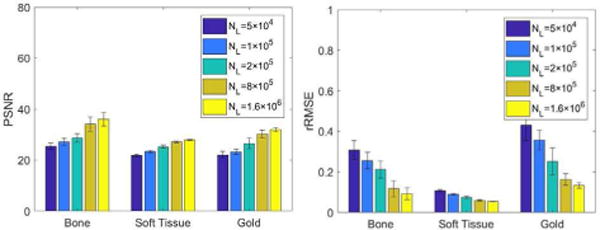
The average of PSNR and rRMSE of material specific images decomposed from dual-energy images with different dose levels.
Fig. 13.
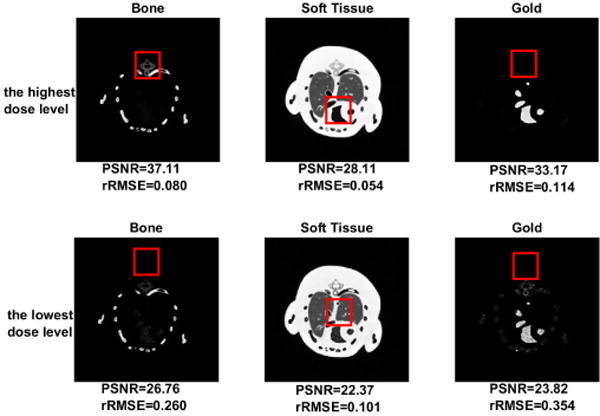
Material specific images decomposed from dual-energy images levels (40kVp and 60kVp) with the highest and the lowest dose.
Fig. 14.
Magnified material specific images in the red squares in Fig. 13.
IV. Discussion and Conclusion
The dual energy CT offers capability for material differentiation which is vitally important for clinical applications. For instance, it could be used to detect the character of given materials and quantify the corresponding amounts [7]. This study focuses on a series of numerical simulations to optimize energy combination below K-edge of gold. Using the optimized energy combination below K-edge, both tumor sites perfused with the gold-based contrast agents and anatomical structures of small animals (e.g. nude mice) could be clearly visible. We implement an image-domain dual-energy material decomposition algorithm to differentiate bone, soft tissue and gold-based contrast agents for energy combination optimization. In our numerical simulations, the energy combinations are ignored when the difference between two energies is smaller than 15kVp because a previous study showed the RMSE values is higher than others when the difference between two energies is 10kVp [11].
In realistic preclinical experiments, the injected gold nanoparticles will diffuse in the mice in a short period that prevents us from testing multiple dual-energy combinations. Quantitative pharmacokinetics with graphite furnace atomic absorption spectroscopy shows that blood gold concentration decreases with a 50% drop between 2–10 minutes [3]. Thus, it is crucial to estimate the optimal dual-energy range before performing in vivo small animal experiments.
The concentration of contrast agents is also critical, which has been demonstrated in our simulations. Our simulation results show that the accuracies of bone images decrease with respect to the increase of gold concentration, and the accuracies of soft tissue images increase with respect to the increase of gold concentration. In that, if the gold concentration level is too high, it will be difficult to differentiate gold and bone during the process of optimization. Vice versa, if the gold concentration level is too low, it will be difficult to separate gold and soft tissue. Potential toxicity is another concern in preclinical and clinical applications. It is reported that mice could survive over 1 year without signs of illness with intravenously injected gold nanoparticles at 2.7 g Au kg−1. Thus, in preclinical experiments, it is crucial to estimate the optimal concentration range before injecting gold nanoparticle into the mice.
The extrinsic Aluminum filtration can increase the mean energy of spectrum but does not significantly improve the decomposition results. The lower dose level will introduce more noise. Under this circumstance, many the state-of-the-art algorithms are unstable when the noise level is high. For example, the HYPR-NLM framework does not show obvious improvement when the dose levels are 5×10⁴ and 1×10⁵.
Regarding the material decomposition algorithm, the direct matrix inversion is easy for understanding and implementation with high noise. In the near future, we will implement new approach to denoise the material specific images, especial for gold images because gold can be passively accumulated at the tumor sites to visualize the physiological characterizations of tumor vasculature. Furthermore, due to the radiosensitivity property of gold nanoparticles, the improvements of gold images quality and accuracy will benefit radiation therapy. Meanwhile, the noise distributions in material specific images are not uniform. An adaptive NLM or other denoising framework is needed.
In summary, the image-domain dual-energy material decomposition is a convenient method in clinical and preclinical applications because it is directly performed on the reconstructed CT images. The optimal energy combination and appropriate concentration of contrast agents provide an efficient path toward higher accuracy in material decomposition. Based on the quantitative analysis results of material decomposition, the optimized energy combinations gather in a certain range where the low-energy is 30kVp-40kVp and the high-energy is 55kVp-75kVp. Our results can provide a practical guidance for the design of in vivo small animal experiments using gold-based contrast agents.
Acknowledgments
This work was supported in part by NIH/NIBIB U01 grant EB017140.
References
- 1.Cavanaugh D, Johnson E, Price RE, Kurie J, Travis EL, Cody DD. In vivo respiratory-gated micro-CT imaging in small-animal oncology models. Mol Imaging. 2004;3(1):55–62. doi: 10.1162/15353500200403184. [DOI] [PubMed] [Google Scholar]
- 2.Clark DP, Ghaghada K, Moding EJ, Kirsch DG, Badea CT. In vivo characterization of tumor vasculature using iodine and gold nanoparticles and dual energy micro-CT. Phys Med Biol. 2013;58(6):1683. doi: 10.1088/0031-9155/58/6/1683. [DOI] [PMC free article] [PubMed] [Google Scholar]
- 3.Hainfeld JF, Slatkin DN, Focella TM, Smilowitz HM. Gold nanoparticles: a new X-ray contrast agent. Br J Radiol. 2006;79(939):248–253. doi: 10.1259/bjr/13169882. [DOI] [PubMed] [Google Scholar]
- 4.Dorsey JF, et al. Gold nanoparticles in radiation research: potential applications for imaging and radiosensitization. Transl Cancer Res. 2013;2(4):280–291. doi: 10.3978/j.issn.2218-676X.2013.08.09. [DOI] [PMC free article] [PubMed] [Google Scholar]
- 5.Connor EE, Mwamuka J, Gole A, Murphy CJ, Wyatt MD. Gold nanoparticles are taken up by human cells but do not cause acute cytotoxicity. Small. 2005;1(3):325–327. doi: 10.1002/smll.200400093. [DOI] [PubMed] [Google Scholar]
- 6.Manuscript A. Focus on Micelles. 2015;9(1) [Google Scholar]
- 7.Mendonca PRS, Lamb P, Sahani DV. A flexible method for multi-material decomposition of dual-energy CT images. IEEE Trans Med Imaging. 2014;33(1):99–116. doi: 10.1109/TMI.2013.2281719. [DOI] [PubMed] [Google Scholar]
- 8.Zhao W, et al. Using edge-preserving algorithm with non-local mean for significantly improved image-domain material decomposition in dual-energy CT. Phys Med Biol. 2016;61(3):1332–1351. doi: 10.1088/0031-9155/61/3/1332. [DOI] [PubMed] [Google Scholar]
- 9.Maaß C, Meyer E, Kachelrieß M. Exact dual energy material decomposition from inconsistent rays (MDIR) Med Phys. 2011 Feb;38(2):691–700. doi: 10.1118/1.3533686. [DOI] [PubMed] [Google Scholar]
- 10.Niu T, Dong X, Petrongolo M, Zhu L. Iterative image-domain decomposition for dual-energy CT. Med Phys. 2014;41(4):41901. doi: 10.1118/1.4866386. [DOI] [PubMed] [Google Scholar]
- 11.Badea CT, Johnston SM, Qi Y, Ghaghada K, Johnson GA. Dual-energy micro-CT imaging for differentiation of iodine- and gold-based nanoparticles. 2011;7961:79611X. [Google Scholar]
- 12.Granton PV, Pollmann SI, Ford NL, Drangova M, Holdsworth DW. Implementation of dual- and triple-energy cone-beam micro-CT for postreconstruction material decomposition. Med Phys. 2008;35(11):5030. doi: 10.1118/1.2987668. [DOI] [PubMed] [Google Scholar]
- 13.Vinegar HJ, Wellington SL. Tomographic imaging of three-phase flow experiments. Rev Sci Instrum. 1987;58(1):96–107. [Google Scholar]
- 14.Zhang Y, Yu H. Tensor Decomposition and Non-Local Means (TDNLM) Based Spectral CT Image Denoising. IEEE Transactions on Medical Imaging. 2016 [Google Scholar]
- 15.Nuyts J, De Man B, Fessler JA, Zbijewski W, Beekman FJ. Modelling the physics in the iterative reconstruction for transmission computed tomography. Phys Med Biol. 2013;58(12):R63–96. doi: 10.1088/0031-9155/58/12/R63. [DOI] [PMC free article] [PubMed] [Google Scholar]
- 16.https://bps-healthcare.siemens.com/cv_oem/radIn.asp


