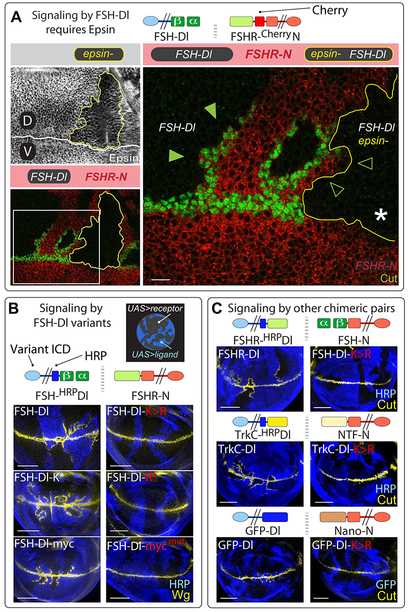
Figure 3. Signaling by FSH-Dl requires access to the Epsin/Clathrin endocytic pathway.
A) epsin¯ clones coinduced in wing discs composed of mutually exclusive subpopulations of FSH-Dl and FSHR-N expressing cells (epsin¯ clones are marked “black” by the absence of anti-Epsin staining and outlined in yellow; FSHR-N cells are marked red by a Cherry tag in FSHR-N; FSH-Dl cells are marked black by the absence of Cherry; here and in subsequent Figures, the relevant clonal genotypes are outlined and color coded as in the banners, and boxed regions are shown at higher magnification). UAS>FSH-Dl epsin¯ cells do not induce Cut in abutting FSHR-N cells (empty arrow heads), in contrast to UAS>FSH-Dl cells that retain wild type epsin function (filled arrow heads; the white asterisk marks the loss of Cut expression where the epsin¯ clone abuts the D/V boundary; see Figures S3-S5). Scale bar: 10μm.
B) Signaling by FSH-Dl variants requires that they access the Epsin/Clathrin pathway. FSH-Dl cells (blue) induce ectopic Wg (yellow) in adjacent FSHR-N cells (black) when the ligand has access to the Epsin pathway or can be targeted directly to Clathrin, bypassing the requirement for Epsin (FSH-Dl, FSH-Dl-K*, and FSH-Dl-myc; Figure 1A). In contrast mutated forms of these ligands that cannot access the Epsin/Clathrin route (FSH-Dl-K>R, FSH-Dl-R* and FSH-Dl- mycmut; Figure 1B) do not. Scale bars: 50μm.
C) FSHR-Dl/FSH-N, TrkC-Dl/NTF-N, and GFP-Dl/Nano-N chimeric ligand pairs (Figure 1A) all signal, albeit weakly in the case of GFP-Dl/Nano-N, in response to their corresponding ligand, but not the K>R variant of that ligand. Scale bars: 50μm.

