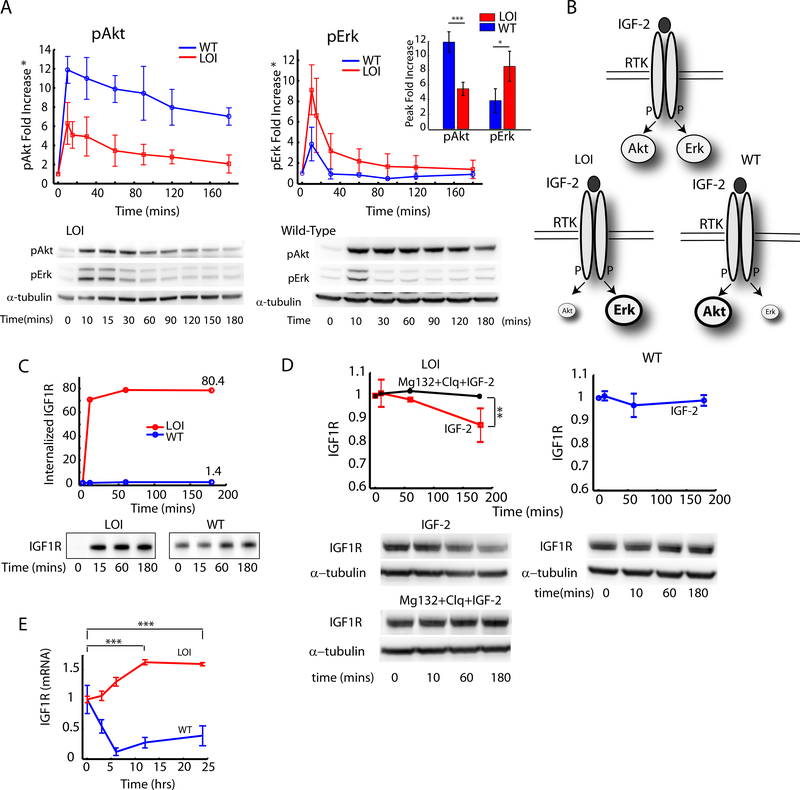
Fig. 1 : Analysis of the effects of Loss of Imprinting of IGF2 on the IGF1R pathway dynamics and IGF1R trafficking:
A) The fold increase in pAkt and pErk signaling was measured in WT and LOI cells by stimulating with 100ng/ml of IGF2 for the indicated time intervals and analzyed by immunoblotting. The fold increase in pAkt and pErk signaling over the baseline at time t=0 was computed and plotted as an average of three independent experiments with error bars for standard error of the means (Inset: Peak values at t=10 min); B) Schematic of the re-balancing of the IGF2 signaling network. C) Internalization rate of IGF1R was measured in a receptor biotinylation assay with IGF2 stimulation. The fold increase in total internalized receptors was quantified and plotted as a function of time; (D) Ligand mediated receptor degradation in LOI and WT cells was analyzed by using inhibitors of lysosomal (Chloroquine) and proteasomal (Mg132) receptor degradation; (E) IGF1R mRNA levels in LOI and WT cells measured after stimulation with IGF2(100ng/ml) for the indicated time points and analyzed by qRT-PCR. IGF-1R expression was normalized against β-Actin in each well and plotted as a fold increase over the baseline. Atleast 3 biological replicates were used in (D) and (E). Raw images are available at the Mendeley link.

