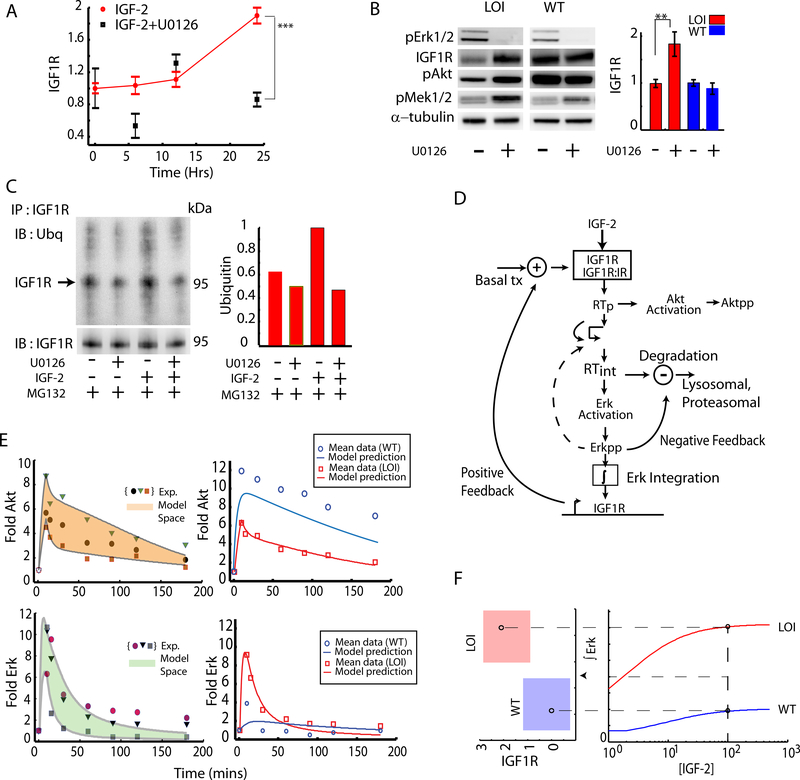
Fig 3: Quantifying the effect of Erk mediated feedback loops:
(A) Effect of Erk on Igf1r transcription was measured in LOI cells stimulated with IGF2, using the Mek1,2 inhibitor U0126. The Igf1r expression was averaged over 3 experiments and plotted as a fold increase over the baseline. Error bars represent standard error of the mean; (B) Effect of Erk on IGF1R degradation in LOI and WT cells was assessed in the presence of Mek1,2 inhibitor U0126. pMek and pAkt were also measured to confirm downstream effects of IGF1R levels. The immunoblots were quantified and plotted as an average of 3 experiments; (C) Ubiquitination of IGF1R in LOI cells was measured and quantified (right panel) with or without the U0126-mediated Mek1,2 inhibition, by immunoprecipitating IGF1R and immunoblotting with an antibody against Ubiquitin. The proteasomal inhibitor MG132 was used to preserve the ubiquitinated IGF1R against degradation; (D) A computational model incorporating signaling pathway elements, i.e., receptor trafficking, Akt/Erk activation and Erk-driven feedback loops, was implemented as shown in the schematic and described in Supp. Materials; (E) Computational model training and prediction: the 3 sets of data for pAkt and pErk dynamics used to train the computational model are shown in symbols in the left hand panel. The computational model output covering the training set (the model space), was obtained by allowing parameter variation, and is shown as a shaded region. The model was then further tested (right panel) by generating the predictions for the average signaling dynamics based on the training sets (red curves) along with the average pAkt and pErk signaling shown in red symbols. The computational model prediction for WT behavior simulated by reduced IGF1R and internalization rate is shown in blue curves while the corresponding experimental data for the WT cells is shown in blue symbols; (F) A threshold for signaling in LOI cells : The time integral of the Erk signaling as predicted by the computational model was plotted as a function of IGF2 concentration which was then extended to show a mapping for time integrated Erk and a regime of transcriptional regulation of IGF1R. The red regime indicates a 2-fold increased transcriptional increase of IGF1R in the LOI cells.

