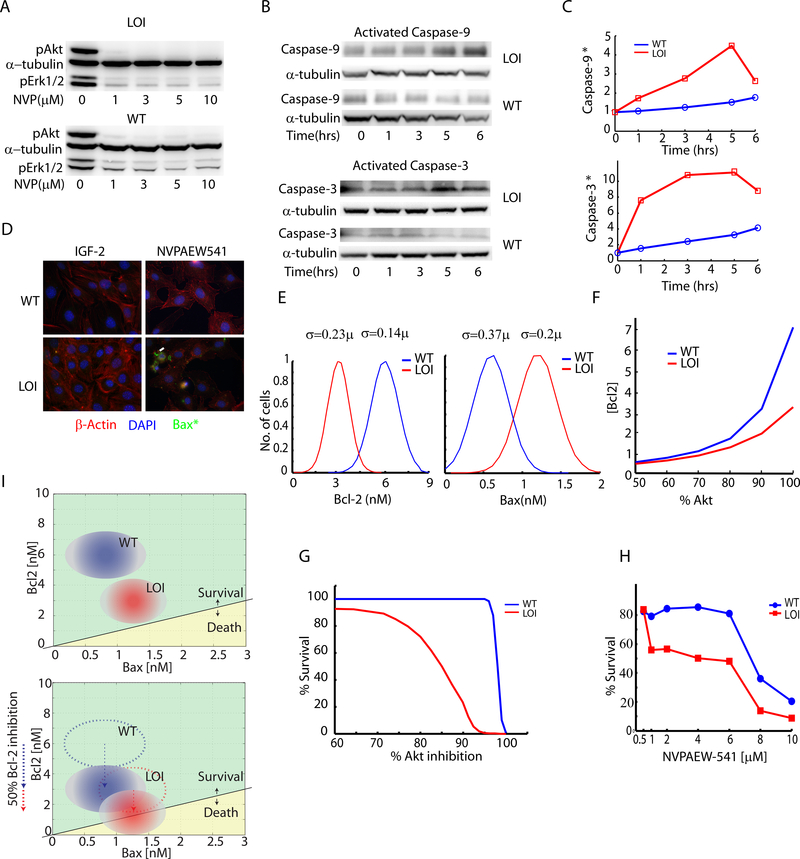
Fig 5 : Analysis of the increased susceptibility of LOI cells to IGF-1R kinase inhibition:
(A) WT and LOI cells were treated with indicated doses of IGF1R inhibitor NVPAEW-541 and analyzed by immunoblotting for pAkt and pErk; (B) Caspase activation in NVPAEW-541 was detected by probing for activated Caspase-9 and Caspase-3 via immunoblotting; (C) Activated Caspase-9 and Caspase-3 were also measured by cleavage of fluorogenic substrates and plotted as a function of fluorescence readout with time; (D) Detection of activated Bax in LOI and WT cells treated with NVPAEW-541 was performed by immunocytochemistry. Activated Bax is shown in green. The cells were counterstained with nuclear DAPI (blue) and β-Actin staining (red); (E) Gaussian distributions of Bax and Bcl-2 were generated with means (see Supp. Material) and standard deviations computed from the joint distributions (cf. Fig. 4F) for both WT and LOI cells; (F) Utilizing the IGF2 computational model a relationship between Akt and Bcl-2 as a function of Akt inhibition was generated and plotted; (G) By defining survival as the codition: [Bcl-2]>=[Bax], the Akt inhibition vs. Bcl-2 relationship from (B) along with the Bax/Bcl-2 distributions in (A) were used to compute and plot the cell survival as a percentage of Akt inhibition; (H) WT and LOI cells treated with NVPAEW-541 were assayed for cell survival using Alamar blue dye over a period of 24 hours. The survival was plotted as a percentage of the cells surviving as a function of the dose ; (I) A schematic for the relative positions of WT and LOI cells in the survival-death space was developed and shown as a function of Bax and Bcl-2 concentrations. In the bottom panel is shown the effect of Bcl-2 inhibition on the cells and their positions;

