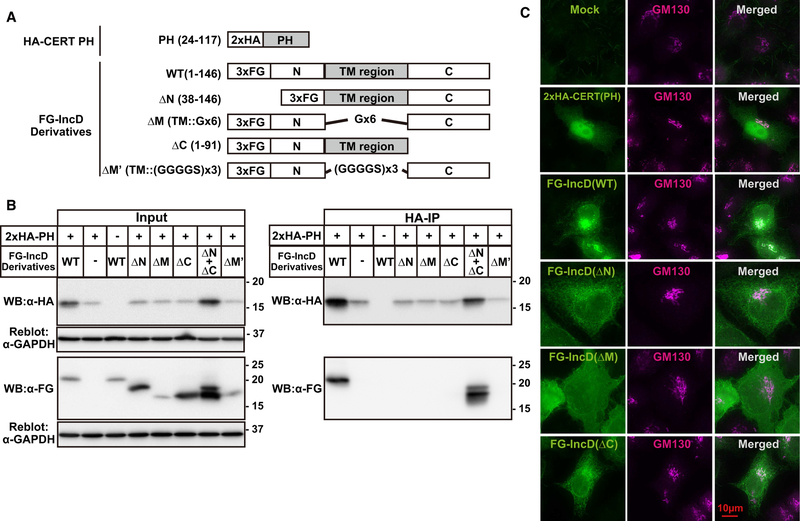
Figure 1. Molecular analysis of the interaction between IncD and CERT PH domain.
(A) Schematic diagram of relevant constructs. The TM region of IncD is highlighted by a grey box. The TM region is replaced with hexa-glycine linker (Gx6) in the construct of FG-IncD ΔM or with three tandem repeats of Gly-Gly-Gly-Gly-Ser (GGGGSx3) in the construct of FG-IncD ΔM’. (B) HeLa cells were co-transfected with pcDNA4/TO encoding the indicated derivatives of FG-IncD together with pcDNA3.1 neo (+) encoding HA-CERT PH. Total amounts of used plasmids for cells were adjusted to constant by adding mock plasmid. For the double transfection with FG-IncD ΔN and FG-IncD ΔC, the same amounts of each plasmid compared to single transfection was used. Cells were lysed with previously described lysis buffer containing 1% Triton X-100 [25]. Left panels: The cell extracts were analysed by Western blotting (Input). The amount loaded as “Input” is 1.0% of the amount used for immunoprecipitation when Western blotting with anti-HA antibody and 0.5% when Western blotting by anti-FLAG antibody. The membranes were reblotted with an anti-GAPDH antibody. Right panels: HA-CERT PH was immunoprecipitated with anti-HA antibody (HA-IP) from the cell extracts and analyzed by Western blotting with the indicated antibodies. Experiments were performed at least three times, and similar results were obtained. (C) HeLa cells were transiently expressed with various derivatives of FG-IncD or HA-CERT PH. The cells were double-labelled by indirect immunostaining with the anti-FLAG antibody (green) and anti-GM130 antibody (magenta) for the cells expressing derivative of FG-IncD or with the anti-HA antibody (green) and anti-GM130 antibody (magenta) for the cells expressing HA-CERT PH. The cells were observed by fluorescence microscopy. Experiments were performed at least three times, and similar results were obtained. Typical staining patterns are shown. The bar indicates 10 μm.

