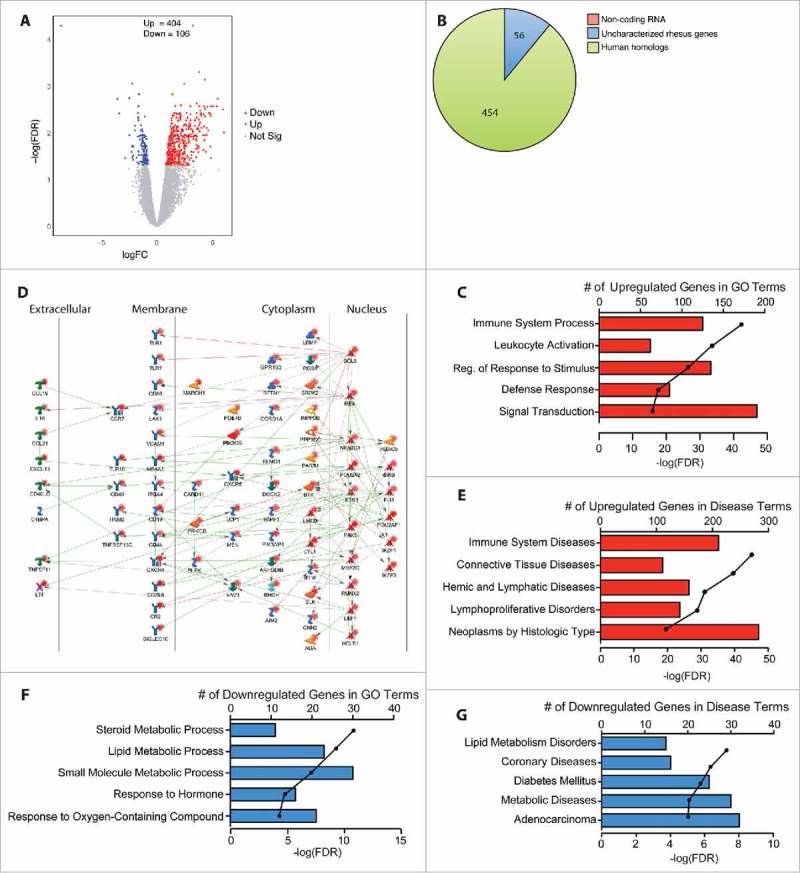
Figure 2.

Chronic heavy ethanol consumption modulates expression of genes important for immune system processes in the ileum. DEG were identified using the generalized linear model likelihood ratio test method from the edgeR package as those with a fold change of ≥2 and a Benjamini-Hochberg- corrected false discovery rate (FDR) of <0.05. (A) Volcano plot summarizing the gene expression changes with red representing the upregulated DEG and blue representing the downregulated DEG. The number of up- and down-regulated genes is noted. (B) Pie chart representing the breakdown of DEG as noncoding RNA, uncharacterized rhesus genes, and human homologs. (C) Bar graphs displaying the number of DEG upregulated with ethanol consumption that enriched to the listed Gene Ontology (GO) terms; line represents the -log(FDR-adjusted P-values) associated with each enrichment to a GO term. (D) Network image of the upregulated DEG that enriched to “immune system process” and directly interact with one another. (E) Bar graphs displaying the number of DEG upregulated with ethanol consumption that enriched to the Disease terms; line represents the -log(FDR-adjusted P-values) associated with each Disease. (F) Bar graphs displaying the number of DEG downregulated with ethanol consumption that enriched to the listed GO terms; line represents the -log(FDR-adjusted P-values) associated with enrichment to each GO term. (G) Bar graphs displaying the number of DEG upregulated with ethanol consumption that enriched to the Disease terms; line represents the -log(FDR-adjusted P-values) associated with each Disease term.
