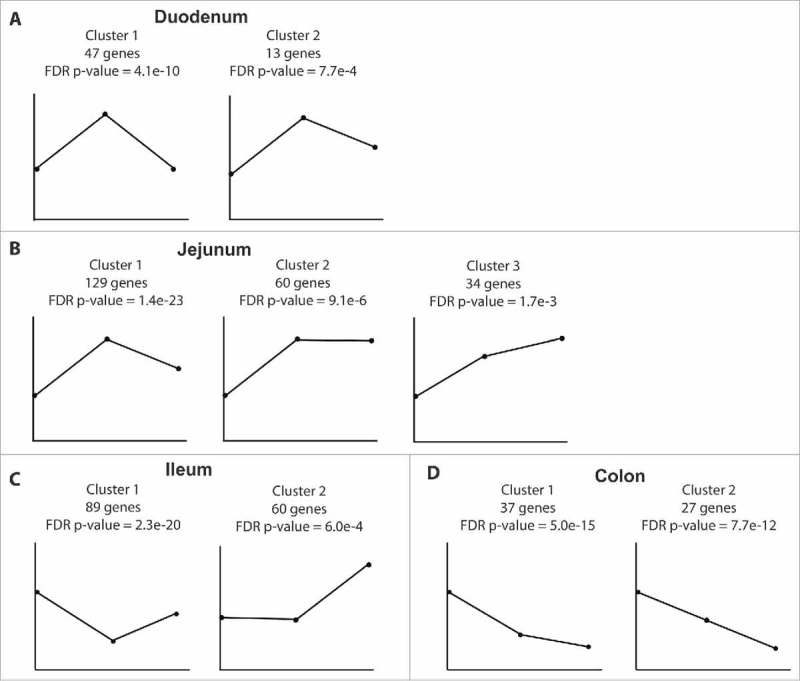
Figure 4.

Dynamic gene expression changes mediated by ethanol consumption. Expression patterns of DEG clusters uncovered by STEM analysis in (A) duodenum, (B) jejunum, (C) ileum, (D) and colon with the number of genes and FDR p-value reported. First point represents controls (n = 4); second point represents non-heavy group (n = 4) and last point represents heavy group (n = 4).
