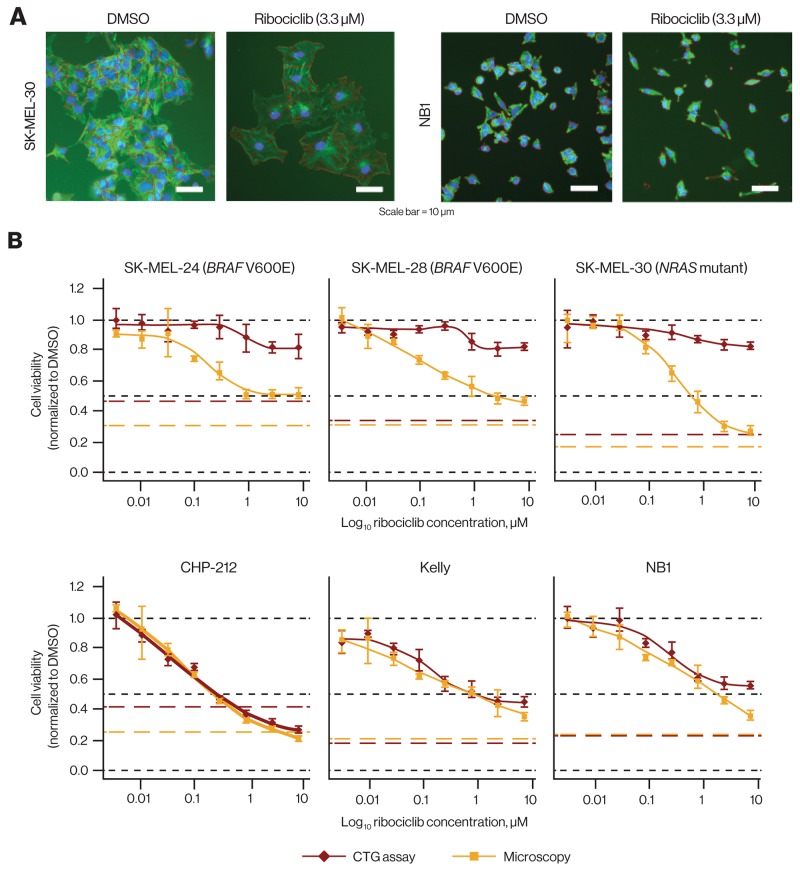
Figure 2. Discrepancy of ribociclib effects in vitro comparing ATP quantification and microscopy.
(A) Cells after 72-hour ribociclib treatment (3.3 μM) vs DMSO. Ribociclib treatment affected the number of NB1 cells without apparent size changes and resulted in increased size of SK-MEL-30 cells accompanied by a reduction in number (original magnification × 10; tubulin [green] and DNA/nuclei [blue] stained with anti–-α-tubulin FITC antibody and Hoechst 33342, respectively). (B) Dose-response curves comparing cell viability by ATP quantification and microscopy in 3 melanoma cell lines (upper panel) and 3 neuroblastoma cell lines (lower panel). In melanoma cell lines, only microscopy robustly detected growth inhibition by ribociclib, while in neuroblastoma cell lines, both readouts yielded similar results. Red and yellow broken lines indicate the pretreatment signal (CTG and number of cells before addition of ribociclib). Black broken lines indicate cell viability of 0, 0.5, and 1. ATP, adenosine triphosphate; CTG, CellTiter-Glo®; DMSO, dimethyl sulfoxide; FITC, fluorescein isothiocyanate.

