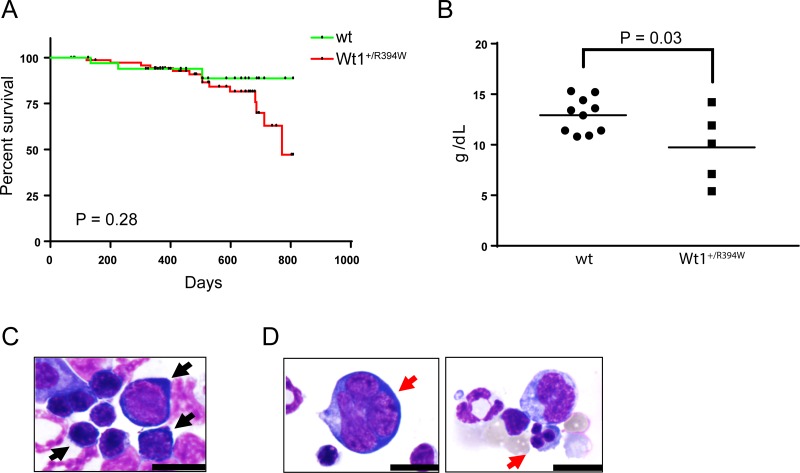
Figure 1. Hematologic characterization of knock-in Wt1+/R394W mice.
(A) Kaplan–Meier survival curve of knock-in Wt1+/R394W mice (n = 76) and wild type (wt) littermates (n = 36). (B) Hemoglobin values of moribund Wt1+/R394W mice (n = 5, mean hemoglobin 9.74 g/dL ± 1.59) compared to age-matched wt mice (n = 10, mean hemoglobin 12.93 g/dL ± 0.55, p = 0.03). Horizontal bars represent the mean values. Representative bone marrow cytospins are shown of (C) wild type mice and (D) moribund Wt1+/R394W mice (100×; scale bars are 10 microns). (C) Bone marrow from wt mice demonstrates no significant dysplasia in the myeloid or erythroid lineages; black arrows indicate normal erythroid precursors. In (D), red arrows denote early and late erythroid precursors with dysplastic changes in Wt1+/R394W bone marrow.

