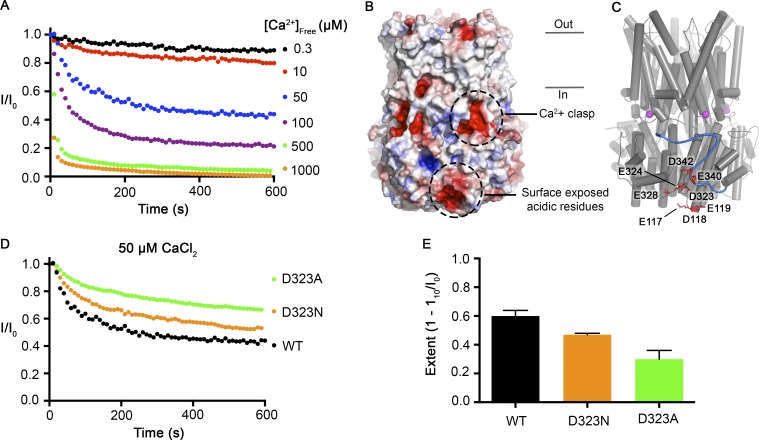
Figure 9.
Surface-exposed acidic residues near the inactivation peptide may underlie the Ca2+ dependence of inactivation. (A) The Ca2+-dependent inactivation of BEST1WT as shown in Fig. 1 A, with additional recordings using 500 µM and 1 mM [Ca2+]free. (B) Surface representation of BEST1 colored by electrostatic potential. Red, −5 kT e−1; white, neutral; blue, +5 kT e−1. (C) Structure of BEST1 with same perspective as in B. The C-terminal tail of one subunit is shown in blue. Acidic residues that create an electronegative patch on the surface are drawn as red sticks. The Ca2+ ions in the Ca2+ clasps are shown as magenta spheres. (D) The Ca2+-dependent inactivation of BEST1WT, BEST1D323A, and BEST1D323N. Recordings were made as described in Fig. 1 A using 50 µM Ca2+. (E) Extent of inactivation in 50 µM Ca2+. Experiments were performed as in D, and at least three independent experiments were performed to calculate SD.

