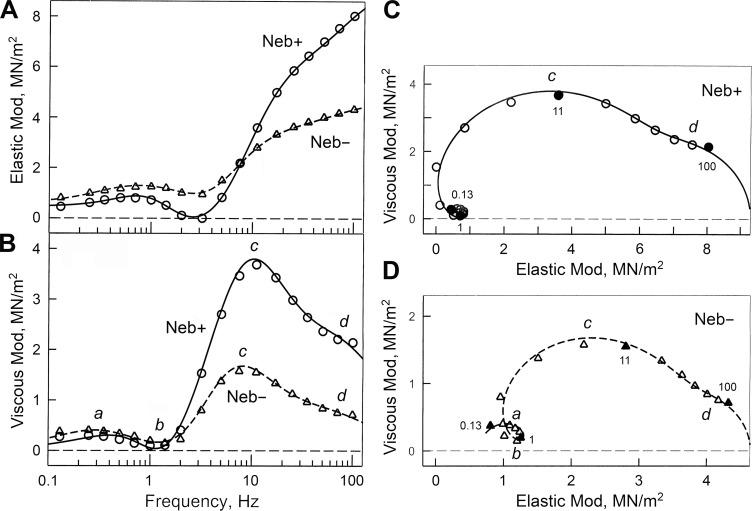
Figure 3.
Comparison of complex moduli of Neb+ and Neb− fibers. (A and B) Elastic modulus (Mod; A), and viscous modulus (B), plotted as functions of frequency. (C and D) The same data are plotted in Nyquist plots. In B‒D, a, b, c, and d indicate characteristic frequencies, identifying individual exponential processes. These are defined in Eq. 1 and represent the speed (kinetics) of force transients. Discrete points represent the measured data, and curves represent best fits to Eq. 1. The unit of moduli is MN/m2 = MPa, where M = mega = 106, N = Newton, and Pa = Pascal.

