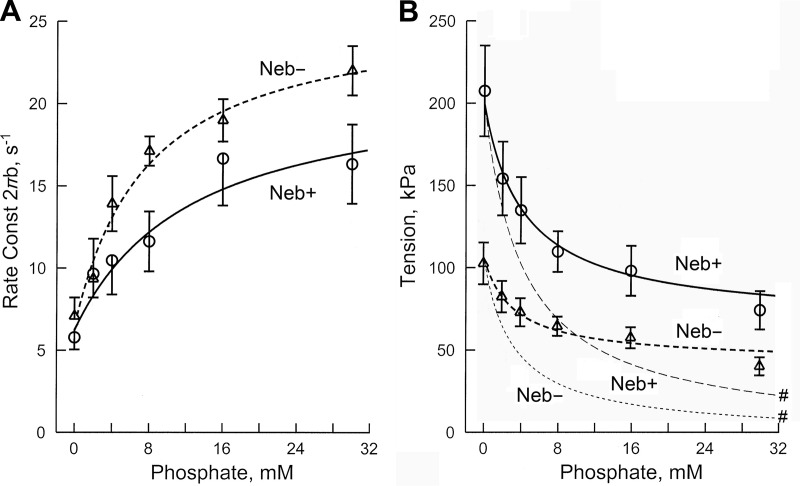
Figure 7.
Effect of Pi on 2πb and active tension. n = 9 (Neb+ fibers), and n = 8 (Neb− fibers). Thick continuous curves represent theoretical projections based on Eqs. 4 and 6 and their best-fit parameters. Thin continuous curves (# in B) represent theoretical projections based on Eq. 7. b is the characteristic frequency of the medium speed exponential delay, and 2πb is its rate constant as defined in Eq. 1.

