
Table 3:
Regression Analyses Showing Independent Associations between QSM of Different Deep Gray Matter Structures and Clinical Variables in Participants with MS
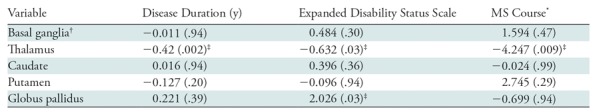
Note.—Data are β coefficients, with P values in parentheses. P values were corrected for false discovery rate. MS = multiple sclerosis, QSM = quantitative susceptibility mapping.
*Coded with relapsing-remitting MS as 1 and secondary progressive MS as 2, such that a negative β coefficient indicates lower susceptibility in participants with secondary progressive MS.
†Basal ganglia was defined as caudate, putamen, and globus pallidus.
‡Indicates significant P values.