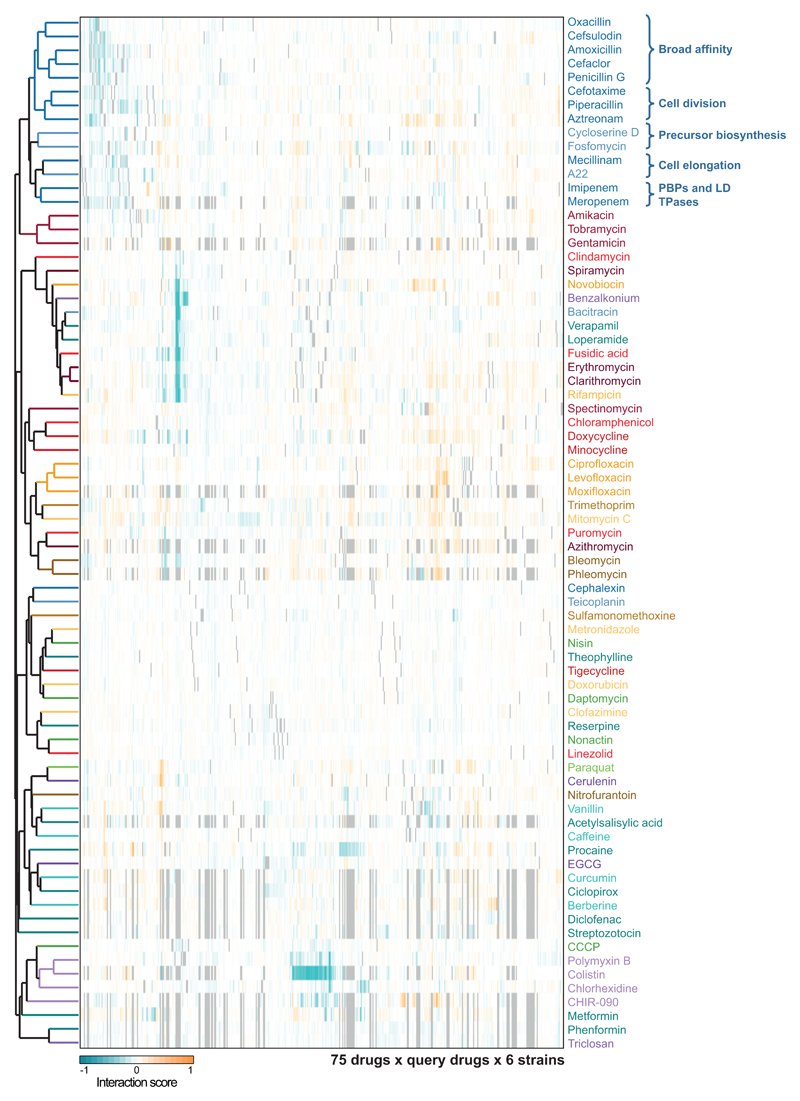
Extended Data Figure 10. Hierarchical clustering of drugs according to their interaction profiles.
Rows depict the 75 drugs common to all strains (colored according to drug category – ED Fig. 1a), and columns account for their interactions with other drugs in all six strains tested. Clustering was done using the median of the ε distributions, uncentered correlation and average linkage.

