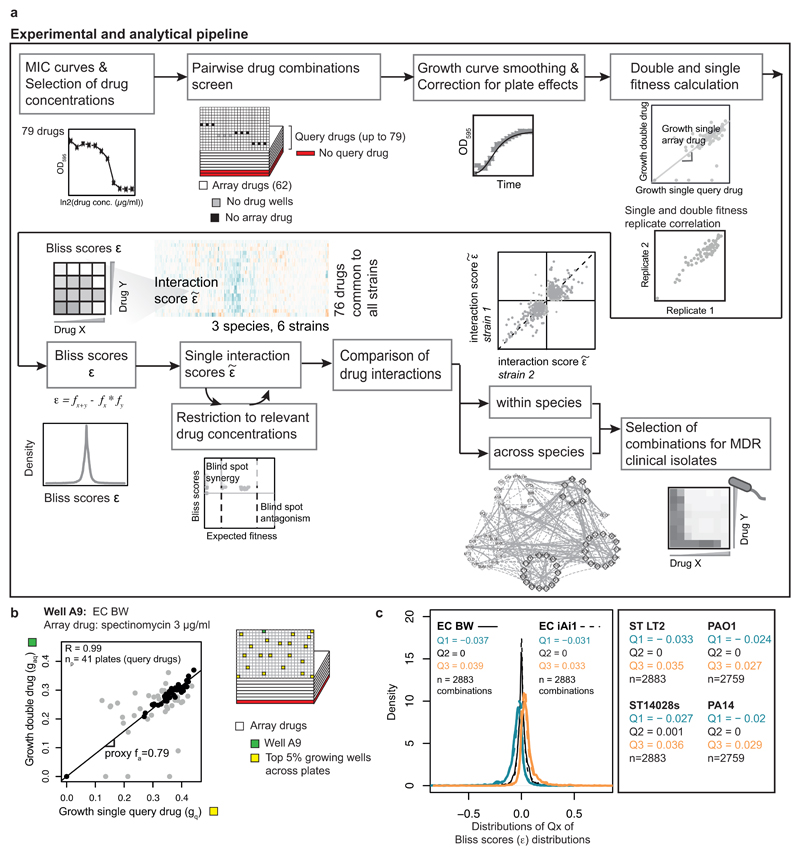
Extended Data Figure 2. Data analysis pipeline.
a) Flowchart of the data analysis pipeline. b) Estimating single drug fitness of arrayed drugs. As drug-drug interactions are rare, the slope of the line of best fit between gaq (growth with double drug) and gq (growth with query drug alone – deduced from average of the top 5% growing wells across plates within a batch) across np query drugs (plates) corresponds to a proxy of the fitness of the arrayed drug alone, fa (Methods, Eq 3). R denotes the Pearson correlation coefficient between gaq and gq across np plates. Well A9 from E. coli BW25113 containing 3µg/ml spectinomycin is shown as an example of arrayed drugs with several interactions; several query drugs (plates) deviate from the expected fitness (light grey points), therefore only half of the plates corresponding to the interquartile range of gag/gq were used to estimate fa. c) Density distributions of quartiles 1, 2 and 3 of Bliss scores (ε) distributions for E. coli. Q1, Q2 and Q3 denote the median of quartiles 1, 2 and 3 of ε distributions, respectively. n denotes the number of drug combinations used.

