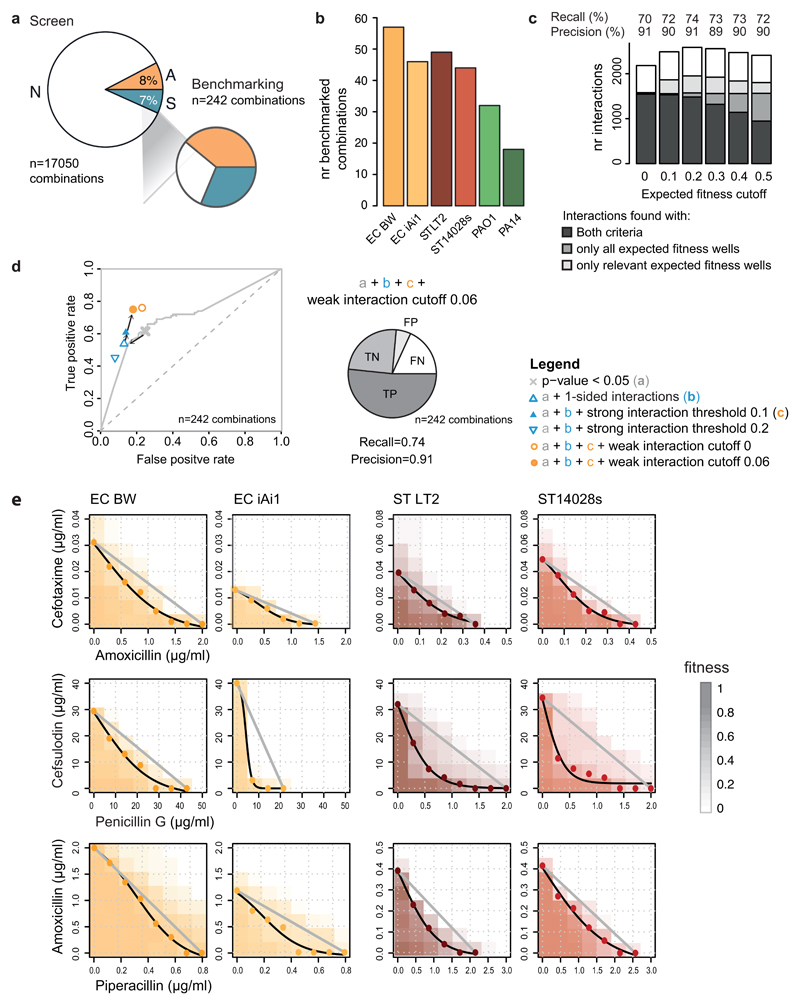
Extended Data Figure 4. Benchmarking & sensitivity analysis.
a) Validation set is enriched in synergies and antagonisms to assess better true and false positives. Comparison of the interaction fractions between the screen and validation set. Both strong and weak interactions (Fig. 2b) are accounted for the screen tally. b) Number of benchmarked interactions per strain. c & d) Sensitivity analysis of the statistical thresholds for calling interactions. c) Total amount of interactions as function of the expected fitness (fx*fy) cutoff used for restricting the ε distributions to relevant drug concentrations. Strong drug-drug interactions are classified according to the ε distribution where they were significant: complete distribution only (i.e. all expected fitness wells), relevant wells only (i.e. all wells with fx*fy > cutoff for synergies and all wells with fx*fy < (1-cutoff) for antagonisms), or in both. Weak drug-drug interactions are independently assigned and represented in white. We selected an expected fitness cutoff of 0.2, as it resulted in the largest number of total interactions detected, with the highest precision and recall (91 and 74% respectively) after benchmarking against the validation dataset. d) Receiver operating characteristic (ROC) curve for the screen across different p-value thresholds (two-sided permutation test of Wilcoxon rank-sum) as a unique criterion for assigning interactions. The selected p-value (0.05) for screen threshold is indicated by a grey cross. Sensitivity to additional parameters for calling hits is shown: allowing interactions to be either antagonisms or synergies but not both (1-sided); strong and weak interaction thresholds. True and false positive rates were estimated based on the validation dataset. Precision and recall for the final and best performing set of parameters are shown: one-sided interactions, p < 0.05, fx*fy cutoff = 0.2 and |ε|>0.1 for strong interactions, |ε| > 0.06 for weak interactions. TP, TN, FP and FN stand for True Positives, True Negatives, False Positives and False Negatives, respectively. n indicates the total number of benchmarked drug combinations (Supplementary Table 3). e) Synergies between β-lactams according to Loewe additivity interaction model. The results of 8x8 checkerboards for 3 combinations between β-lactams in 4 strains are shown. The grey line in each plot represents null hypothesis in the Loewe additivity model, whereas the black line corresponds to the IC50 isobole, estimated by fitting a logistic curve to the interpolated drug concentrations (colored dots, Methods). Piperacillin did not reach 50% growth inhibition in E. coli, thus IC20 and IC40 isoboles were used for the amoxicillin + piperacillin combination in E. coli BW and E. coli iAi1, respectively.

