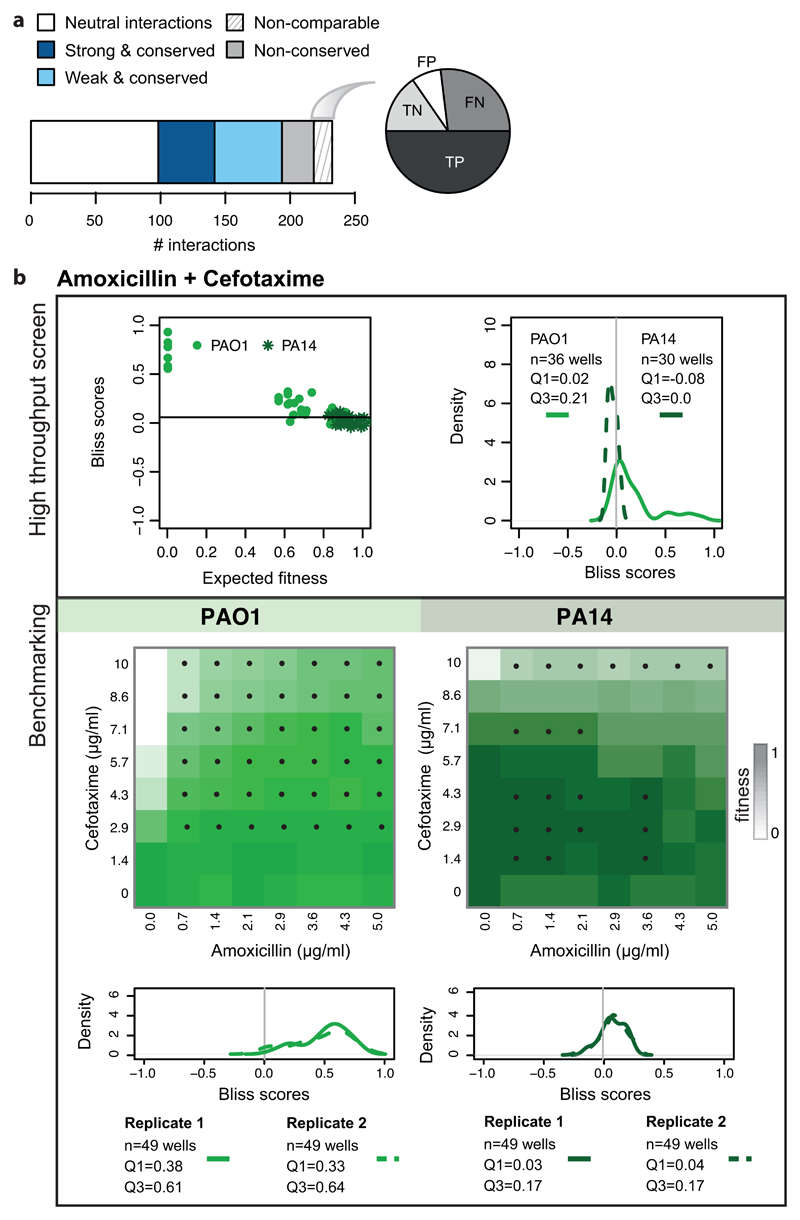
Extended Data Figure 5. Benchmarking of non-comparable drug-drug interactions.
a) The barplot illustrates the division of benchmarked drug combinations according to their degree of conservation within species. The pie chart shows the proportion of False & True Positive (FP & TP) and False and True Negatives (FN & TN) within non-comparable drug-drug interactions. b) Combination of amoxicillin with cefotaxime in P. aeruginosa: an example of a non-comparable drug-drug interaction. The results of the screen are presented on the upper box. Bliss scores as function of expected fitness for both strains are presented on the left hand side, while a density distribution of the Bliss scores is shown on the right hand side. n denotes the total number of Bliss scores, Q1 and Q3 indicate the Bliss score for quartiles 1 and 3, respectively. Antagonism was detected only for PAO1 (Q3 > 0.1). PA14 was resistant to both drugs at concentrations screened (upper left panel), rendering the detection of antagonism impossible. The benchmarking results indicate that interaction is antagonistic in both strains (lower box), albeit weaker at PA14 and visible mostly at higher concentrations. Color on checkerboard reflects fitness and black dots correspond to drug-ratios where the Bliss score is above 0.1.

