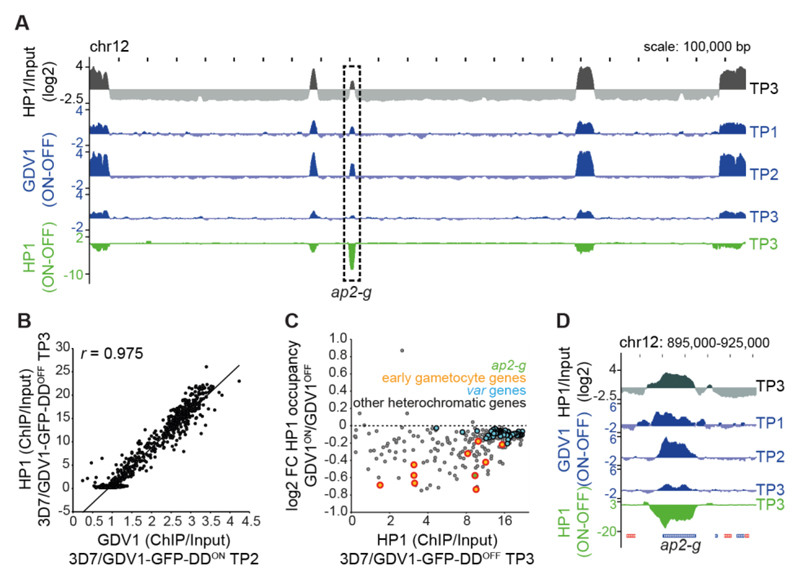
Fig. 3. GDV1 associates with heterochromatin throughout the genome and triggers HP1 removal at ap2-g.
(A) HP1 over input ratio track from 3D7/GDV1-GFP-DDOFF schizonts (38-44 hpi, TP3) (grey). ChIP-seq subtraction tracks display relative enrichment of GDV1-GFP-DD in 3D7/GDV1-GFP-DDON schizonts two (30-36 hpi, TP1), six (34-40 hpi, TP2) and ten (38-44 hpi, TP3) hours after Shield-1 addition (blue), and relative depletion of HP1 in 3D7/GDV1-GFP-DDON parasites at TP3 (green). (B) Correlation between GDV1-DD-GFP enrichment in 3D7/GDV1-GFP-DDON (34-40 hpi, TP2) and HP1 enrichment in 3D7/GDV1-GFP-DDOFF schizonts at each coding region. r, Pearson correlation coefficient. (C) Fold change in HP1 enrichment upon GDV1-GFP-DD overexpression in relation to HP1 enrichment in 3D7/GDV1-GFP-DDOFF schizonts for each heterochromatic gene. (D) Zoom-in view of the enrichment/subtraction tracks at the ap2-g locus.

