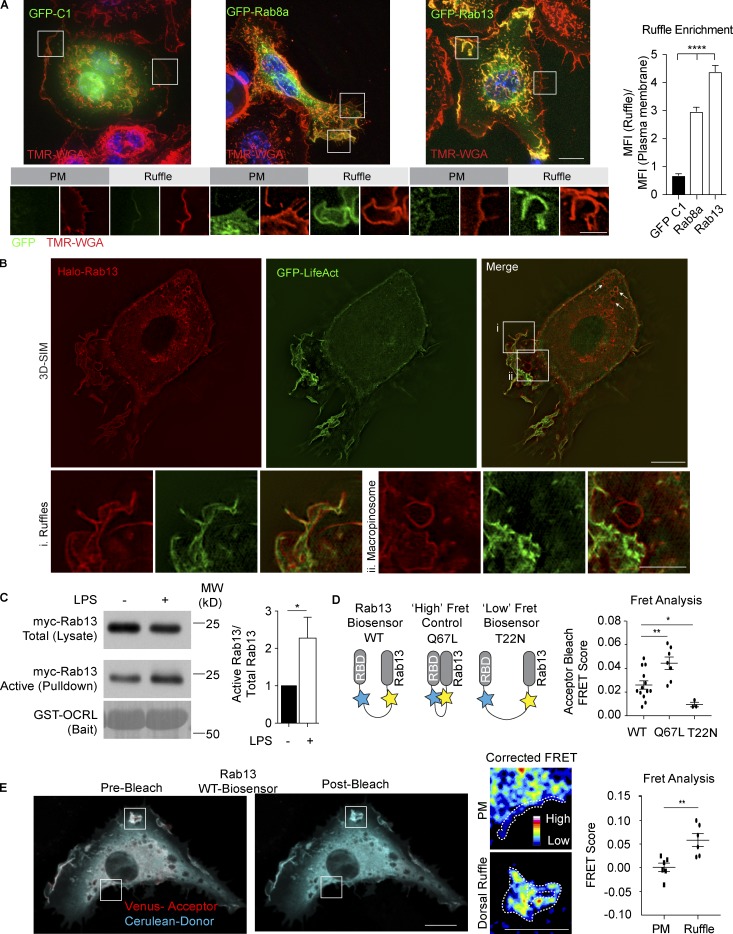
Figure 4.
Identification of active Rab13 in LPS-induced dorsal ruffles. (A) Representative images of macrophages transiently transfected with GFP-C1, GFP-Rab8a, and GFP-Rab13. Cell surfaces were stained using TMR-WGA (red) and cells counter stained with DAPI (blue). 3D stacks were taken using the DeltaVision deconvolution microscope. Inset images show examples of plasma membrane and ruffle regions used to produce the quantification shown for the relative ruffle enrichment by ratio of normalized mean fluorescence intensity (MFI) for both the ruffle and resting regions. Quantification of ruffle enrichment is displayed as mean ± SEM from n = 20 cells per Rab over three independent experiments. Each cell had five independent measurements for ruffles and for plasma membrane regions. (B) 3D-SIM of macrophages stably expressing Halo-Rab13 (red) and GFP-LifeAct (green). Cells were fixed before counterstaining with Halo-Ligand JF549 (10 nM), Rab13 localizes to ruffles (B i) and to peripheral macropinosome-like structures (B ii). (C) Rab13 activation assay. Cell lysates of myc-Rab13 expressing macrophages were analyzed for relative levels of active Rab13. Cells were untreated or treated for 30 min with 100 ng/ml LPS. Western blot is representative of three independent experiments. GST-OCRL (RBD) pulldowns were probed with anti-myc to detect active Rab13. Ponceau stain shows amount of GST-OCRL used as bait. Input cell lysate was run on separate lanes to show total Rab13. Quantification of Western blots are from three individual experiments and displayed as mean ± SEM; *, P < 0.05, where the data are normalized to nonstimulated GTP-Rab13 levels. (D) Schematics of Rab13 FRET biosensors and FRET measurements of whole cells expressing WT, dominant negative (T22N), and constitutively active (Q67L) Rab13 biosensors transiently expressed in macrophages. FRET acceptor bleaching score was calculated on n = 13, 7, and 3 for WT, Q67L, and T22N, respectively, from three independent transfections. Graphs are represented as mean ± SEM. (E) Macrophages transiently expressing the WT Rab13 FRET biosensor were imaged using a Zeiss 710 LSM confocal microscope. Boxed areas within bleached regions highlight ruffles and nonruffle plasma membrane. Within the boxed areas, dotted lines indicate example regions of interest used to calculate FRET scores. Data presented as mean ± SEM; n = 6 cells. Test for statistical significance was calculated using unpaired t tests, where *, P < 0.05 and **, P < 0.01. Bars: 10 µm (main panels); 5 µm (inset panels).

