Figure 5.
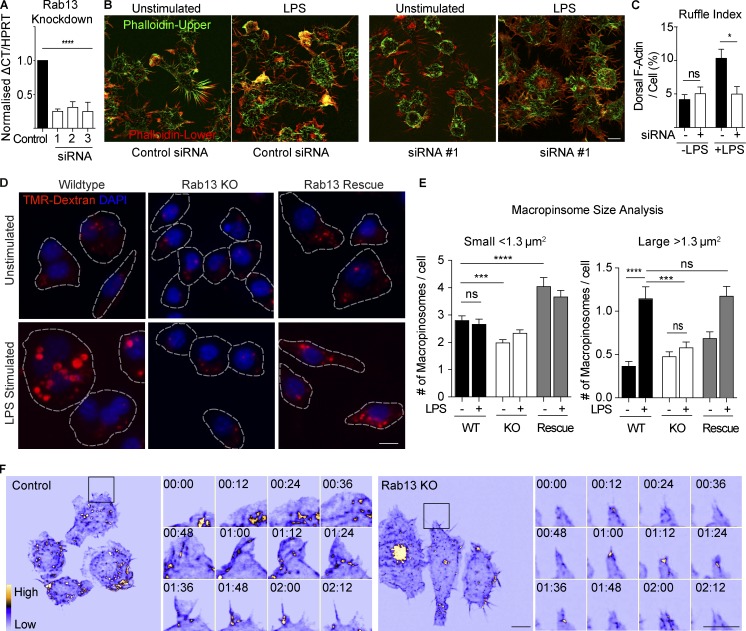
Rab13 regulates dorsal ruffle formation and macropinocytosis in LPS activated macrophages. (A) Real-time quantitative PCR (qRT-PCR) from Rab13 siRNA treated cells using three independent siRNA duplexes. Data are normalized to HPRT and represented as mean ± SEM; n = 3 individual experiments; ****, P < 0.0001. (B and C) Ruffle index assay described in the Materials and methods to quantify ruffling on control and Rab13 siRNA–treated macrophages with and without LPS for 30 min. F-Actin was stained with Alexa Fluor 488–phalloidin and 3D z stacks imaged using a DeltaVision deconvolution microscope. Threshold images of each channel were used for area measurements to generate the Ruffle Index. Data presented as mean ± SEM of ≥10 cells in multiple experiments. *, P < 0.05. (D) Macropinocytosis assay. CRISPR cell lines (WT, Rab13 KO, and Rab13 Rescue) were pretreated with or without 100 ng/ml LPS for 15 min before a 15-min incubation with Alexa Fluor 555–dextran (100 µg/ml). Cell membranes were stained with Alexa Fluor 488–WGA (not shown) to segment cells (dotted lines indicate cell borders), and nuclei were labeled with DAPI after fixation. (E) Macropinosome size analysis. Numbers of small (<1.3 µm2) versus large (>1.3 µm2) macropinosomes were calculated before and after LPS stimulation in each cell line. Data are displayed as mean ± SEM with n ≥ 400 macropinosomes per group. Tests for statistical significance were calculated using unpaired t tests. (F) Control and Rab13 KO cell lines stably expressing GFP-LifeAct were imaged by LLSM. Example frames are displayed as an MIP using the ICA LUT in ImageJ (Video 10). Inset region illustrates a full tent pole ruffling event for control and Rab13 KO cells displayed every 12 s. Tests for statistical significance was calculated using unpaired t tests. Bars, 10 µm. Time stamps, min:s.

