Figure 7. .
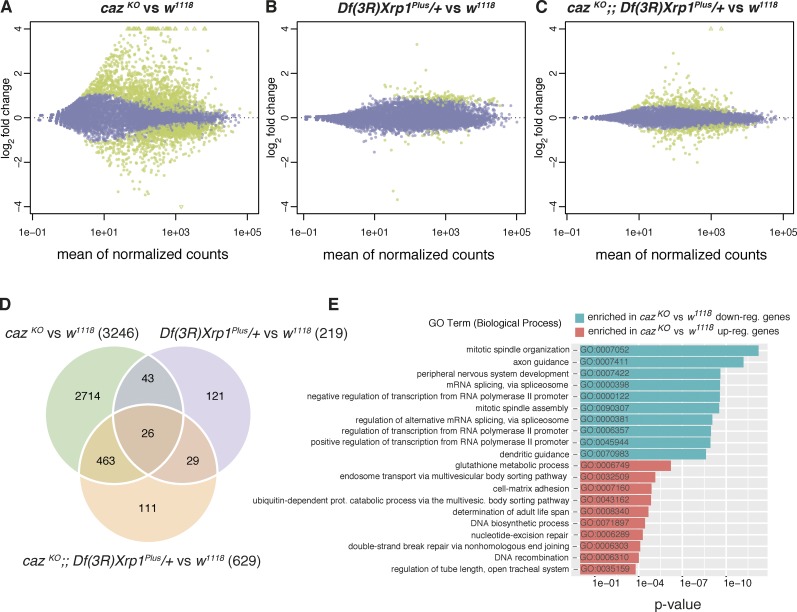
Heterozygosity for Xrp1 mitigates gene expression dysregulation in caz mutant CNS. (A–C) MA plots displaying gene expression changes in cazKO versus w1118 (genetic background control; A), Df(3R)Xrp1Plus/+ versus w1118 (B), and cazKO;; Df(3R)Xrp1Plus/+ versus w1118 (C). X axes represent the mean of the normalized read counts per gene across all samples included in each comparison. Y axes represent the log2 fold change per gene resulting from each comparison. Green dots correspond with differentially expressed genes, with P < 0.05 adjusted for multiple testing. (D) Venn diagram representing the overlap between differentially expressed genes across the three comparisons. Numbers in parenthesis indicate the total number of differentially expressed genes in each comparison. (E) Top 10 enriched GO terms (Biological Process ontology) in the cazKO versus w1118 comparison for the set of up-regulated (red) and down-regulated genes (blue).

