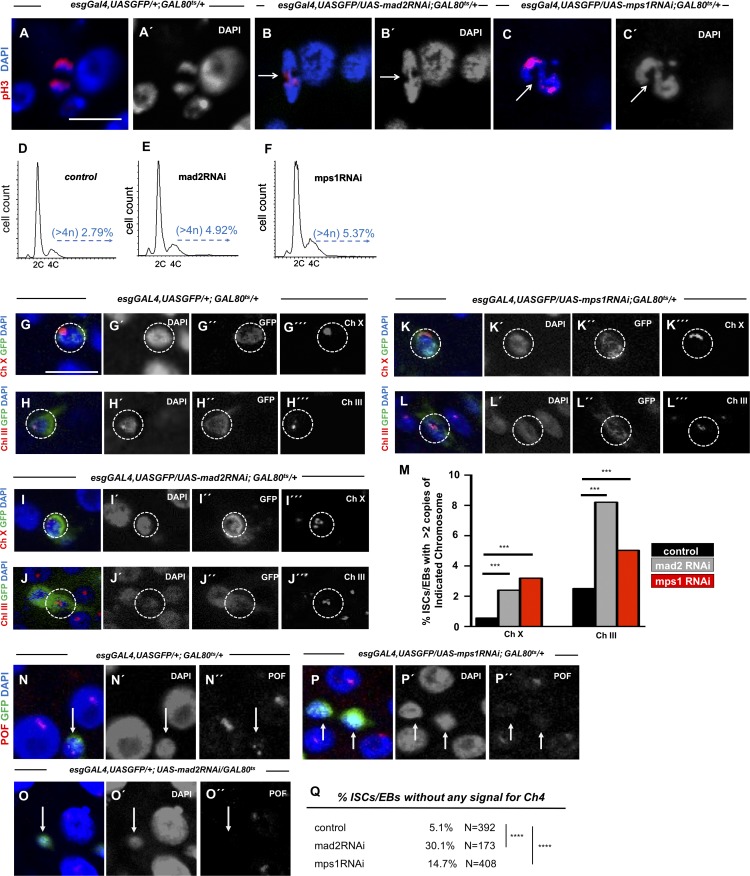
Figure 2.
Induction of aneuploidy in intestinal cells after SAC impairment. (A) Control cell in anaphase. (B and C) Lagging chromosomes/chromatin bridges (white arrows) in dividing cells from 10-d-old mad2RNAi and mps1RNAi flies. (D–F) Examples of FACS profiles of ISCs/EBs from control, mad2RNAi, and mps1RNAi flies. For control versus mad2RNAi, two biological replicates were performed. In both, the percent aneuploidy was higher in the mad2RNAi flies (P < 0.01; Fisher exact t test). For control versus mps1RNAi flies, two biological replicates were performed. In both, the percent aneuploidy was higher in the mps1RNAi (P < 0.01; Fisher exact t test). Average percent aneuploidy ± SD: control, 2.4 ± 0.5; mad2RNAi, 5.4 ± 0.73; mps1RNAi, 7.77 ± 1.1. (G–L) FISH analysis in combination with IF labeling Chromosomes X or III within ISCs/EBs (GFP+/esg+; white circles). Due to somatic chromosome pairing, cells were only scored as aneuploid when more than two FISH signals were observed. (M) Quantification of ISCs/EBs where more than two FISH signals for Chromosome X or III were detected within control, mad2RNAi, and mps1RNAi intestines. n (ISCs/EBs) for controls = 1,161 (Ch III) and 541 (Ch X); n (ISCs/EBs) for mad2RNAi = 841 (Ch III) and 751 (Ch X); n (ISCs/EBs) for mps1RNAi = 936 (Ch III) and 720 (Ch X). (N–P) 15–20-d control, mad2RNAi, and mps1RNAi intestines stained for anti-POF antibody to label the fourth chromosome. Bars, 5 µm. (Q) Percentage of ISCs/EBs where no signal for anti-POF was observed in N–P. N refers to number the ISCs/EBs analyzed in each genotype. ***, P < 0.001; ****, P < 0.0001; Fisher's exact t test.

