Figure 3.
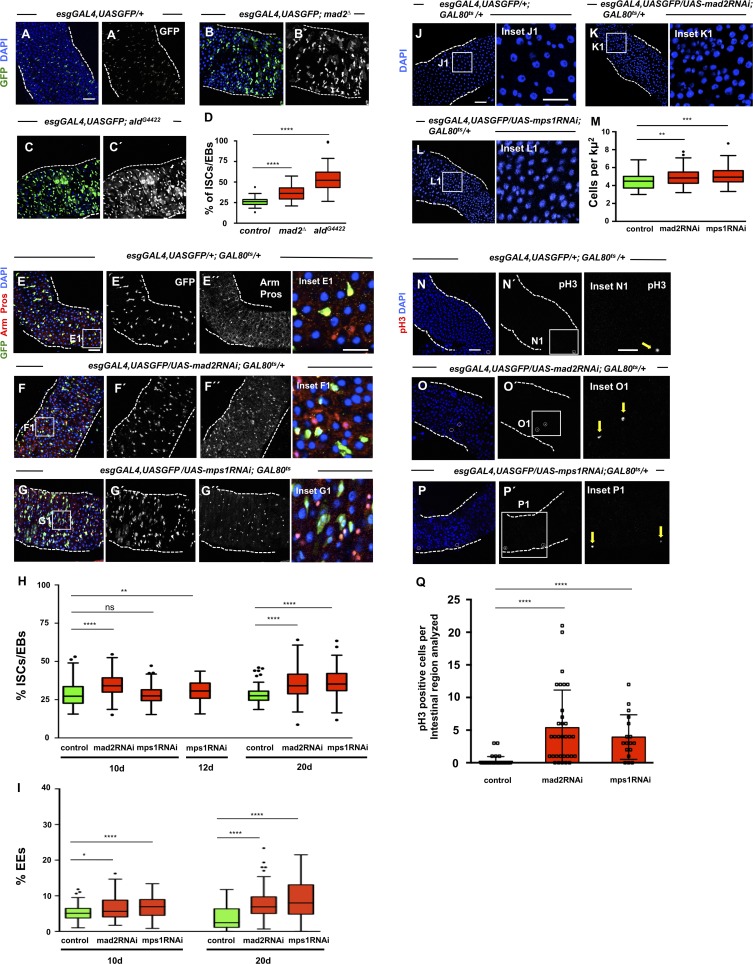
SAC inactivation results in intestinal dysplasia. (A) 2–5-d-old control intestine where ISCs/EBs can be visualized by GFP expression under the control of esgGAL4. DAPI marks cell nuclei. (B and C) 2–5-d-old intestines of homozygous mutants for SAC genes mad2 or mps1. Note accumulation of ISCs/EBs (compare B′ or C′ with A′). (D) Quantification of percent ISCs/EBs (GFP positive) per total cell number in A–C. Tukey boxplots. (E) 20-d-old control intestine where ISCs and EBs are marked based on esg expression (green). EEs can be identified by expression of Pros (nuclear red signal). Arm marks all cell membranes. DAPI marks cell nuclei. (F and G) Intestines where RNAi constructs against SAC genes mad2 or mps1 were expressed under the control of the esgGAL4 promoter during the first 20 d of the adult fly. Note accumulation of ISCs/EBs (compare F′ and G′ with E′ or green cells in the corresponding insets); note also the excess of EEs (compare F′′ and G′′ with E′′ or red nuclear signaling in corresponding insets). (H and I) Quantification of percentage of ISCs/EBs (GFP positive) or EEs (Pros positive) per total cell number in control, mad2RNAi, and mps1RNAi flies at different time points. Tukey boxplots; n = 28 (intestines) for controls at 10 d; n = 22 for mad2RNAi at 10 d; n = 25 for mps1RNAi at 10 d; n = 22 for mps1RNAi at 12 d; n = 21 (intestines) for controls at 20 d; n = 26 for mad2RNAi at 20 d; n = 21 for mps1RNAi at 20 d. (J) 20-d-old control intestine. Cell nuclei are marked by DAPI. (K and L) 20-d-old mad2RNAi and mps1RNAi intestines. Note high cell density (compare K1 or L1 with J1). In control and RNAi conditions, suppression of the GAL4-UAS system was performed during development by using the temperature-sensitive repressor GAL80ts and by raising the flies at 18°C. (M) Quantification of cell densities in J–L. n (intestines) = 20 for controls; n (intestines) = 20 for mad2RNAi; n (intestines) = 18 for mps1RNAi. (N–P) Same genotypes/time points as in E–G or J–L but stained for pH3 to label mitotic cells (white circles or yellow arrows). Bars: 40 µm (main images); 20 µm (insets). (Q) Number of mitotic cells present in the first two fields of view of the posterior midgut after the pyloric ring (40× objective) from situations N–P. *, P < 0.05; **, P < 0.01; ****, P < 0.0001; Mann–Whitney U test. n = 39 flies for controls; n = 32 flies for mad2RNAi; n = 17 flies for mps1RNAi.

