Figure 5.
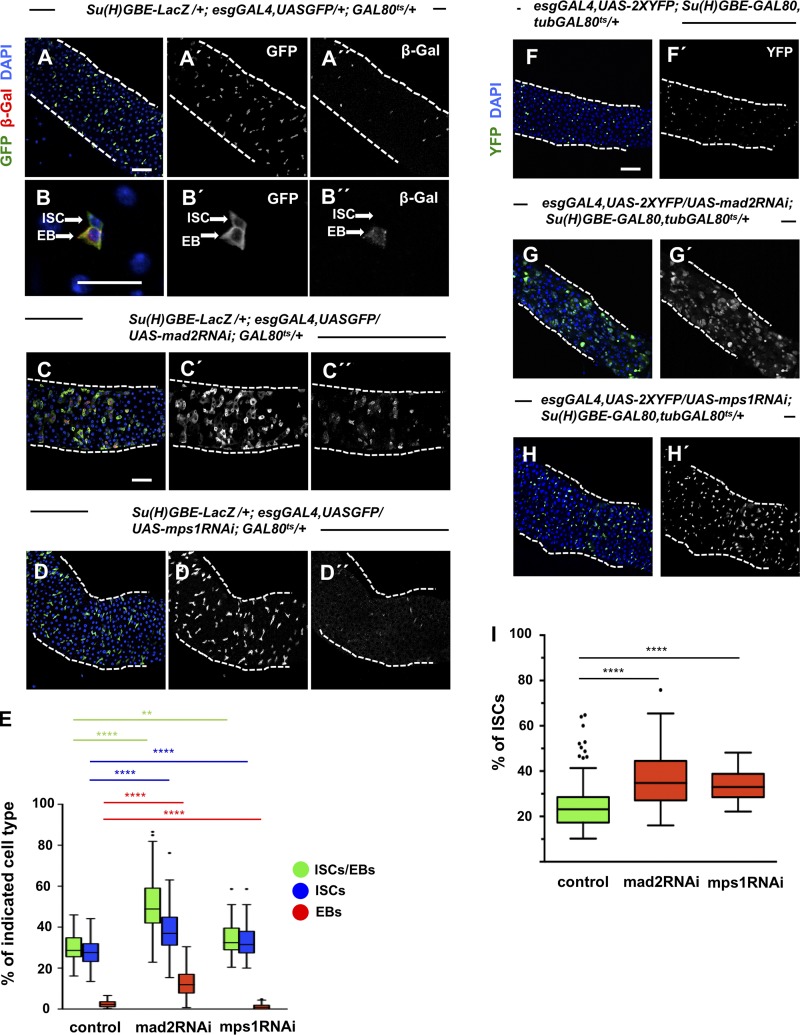
Aneuploidy causes ISC accumulation. (A and B) Low (A) and high (B) magnifications of a 20-d-old control intestine where ISCs and EBs can be distinguished based on expression of Su(H)GBE-LacZ. esg marks ISCs and EBs, and β-Gal marks EBs. (C and D) Intestines where RNAi constructs against Mad2 or Mps1 were expressed under the control of the esgGAL4 promoter during the first 20 d of the adult and where ISCs and EBs can be distinguished as described in A and B. (E) Quantification of percentage of ISCs/EBs (GFP positive), ISCs (GFP positive/β-Gal negative), and EBs (GFP positive/β-Gal positive) per total cell number (DAPI) in control and SAC loss-of-function situations. n = 25 for controls; n = 25 for mad2RNAi; n = 21 for mps1RNAi (intestines). (F) Control intestine where ISCs can be identified by expression of YFP. (G and H) Intestines where RNAi against Mad2 or Mps1 were expressed specifically in ISCs during the first 20 d after eclosion. Bars: 40 µm (A, C, and F); 10 µm (B). (I) Quantification of ISCs in F–H. Tukey boxplots; **, P < 0.01; ****, P < 0.0001; Mann–Whitney U test. n (intestines) = 19 for control; n (intestines) = 23 for mad2RNAi; n (intestines) = 8 for mps1RNAi.

