Figure 6.
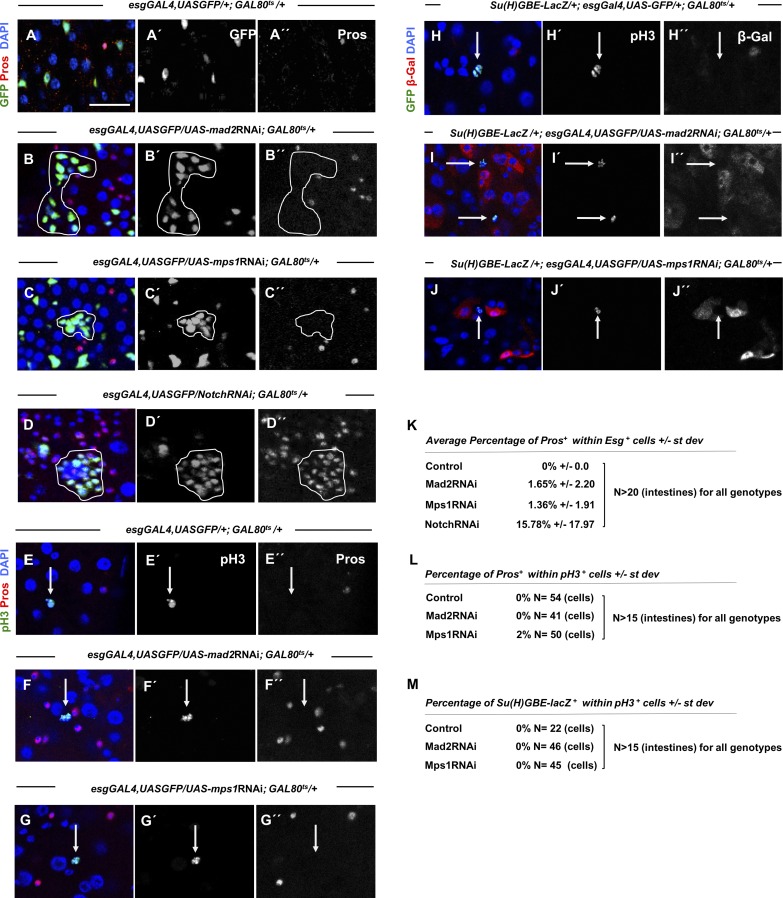
Dysplasia is driven by overproliferative ISCs. (A–D) 10–15-d-old control, mad2RNAi, mps1RNAi, and NotchRNAi intestines where ISCs/EBs and EEs are marked by Esg expression (esgGal4,UASGFP) and Pros (antibody), respectively. Note that in NotchRNAi flies, the dysplastic regions are generally populated by cells that express both markers of ISCs/EBs and EE lineages, in contrast with mad2RNAi and mps1RNAi. Bar, 20 µm. (E–G) 10–15-d-old control, mad2RNAi, and mps1RNAi where mitotic cells are labeled with pH3 and EE cells are marked with Pros. (H–J) 10–15-d-old control, mad2RNAi, and mps1RNAi where mitotic cells are labeled with pH3 and EBs are evident by expression of Su(H)GBE-LacZ. Arrows indicate pH3-positive cells. (K–M) Quantifications of overlap between different indicated cell identity markers or mitotic markers in situations described in A–J.

