Figure 7.
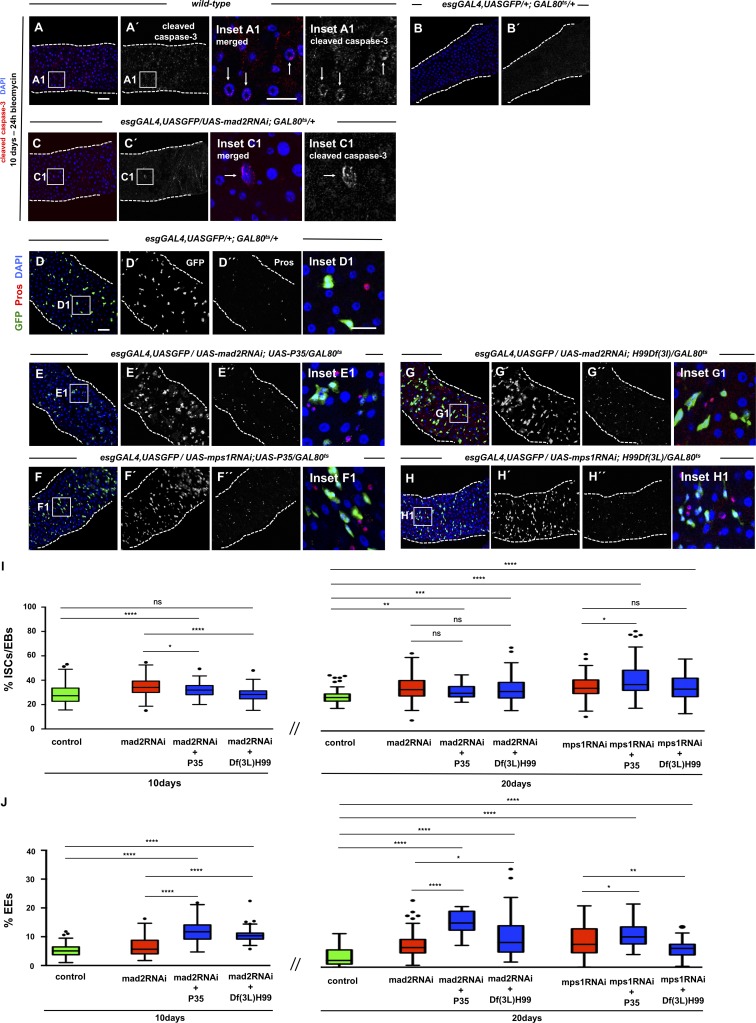
Aneuploidy induction does not result in activation of apoptosis. (A) 10-d-old WT intestine fed 24 h with bleomycin as a positive control for cleaved caspase-3 staining. Many apoptotic cells were detected. Examples are shown in the inset and are indicated by white arrows. (B and C) 10-d-old control and mad2RNAi intestines stained for cleaved caspase-3. No apoptotic cells were found in the control samples. n = 10 intestines. In a total of 17 intestines, apoptotic cells were only found in only two intestines for mad2RNAi (two apoptotic cells in one intestine and three in the other). (D–H) 20-d-old intestines from controls or flies where mad2RNAi or mps1RNAi constructs were expressed in ISCs/EBs; apoptosis was blocked either in ISCs/EBs specifically or in all cell types as indicated in respective genotypes. Bars: 40 µm (main images); 20 µm (insets). (I and J) Quantification of ISCs/EBs or EEs in conditions described in D–H. Control data are the same as shown in Fig. 3. Control, mad2RNAi, and mps1RNAi data are the same as shown in Fig. 2. n = 20 for 10-d mad2RNAi + P35; n = 22 for 10-d mad2RNAi + H99Df(3L); n = 10 for 20-d mad2RNAi + P35; n = 16 for 20-d mad2RNAi + H99Df(3L); n = 12 for 20-d mps1RNAi + P35; n = 16 for 20-d mps1RNAi + H99Df(3L). Tukey boxplots; *, P < 0.05; **, P < 0.01; ***, P < 0.001; ****, P < 0.0001; Mann–Whitney U test.

