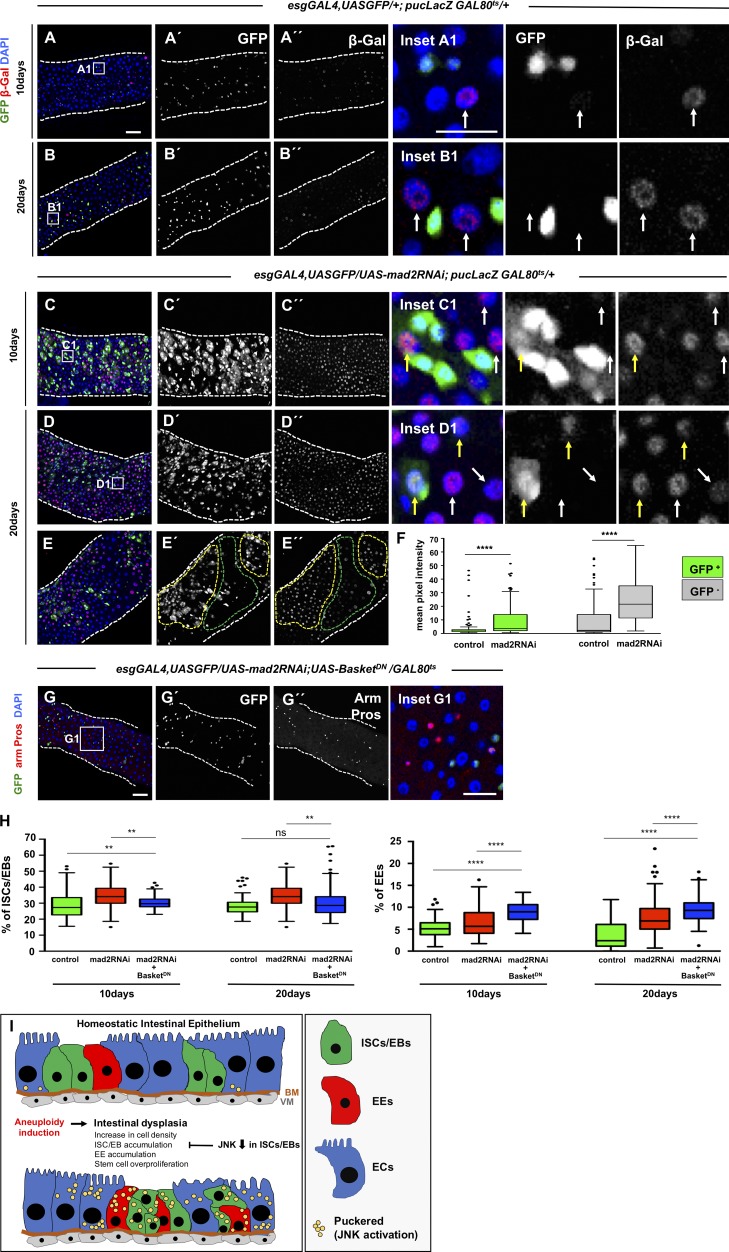
Figure 8.
JNK pathway modulates intestinal dysplasia. (A and B) 10- and 20-d-old control intestines where pucLacZ serves as readout of the activation status of JNK pathway. pucLacZ-positive cells were found in low intensity and in very reduced numbers (white arrows in the insets show examples of pucLacZ-positive cells). (C and D) 10- and 20-d-old intestines where mad2RNAi was expressed and where a strong up-regulation of pucLacZ can be noted (compare C’’ and D’’ with A’’ and B’’). Up-regulation was found in both progenitor cells (Esg positive; yellow arrows in the insets) and differentiated cells (Esg negative; white arrows in the insets). (E) 20-d-old intestine where mad2RNAi was expressed. Note that pucLacZ is up-regulated within midgut regions where dysplasia is more pronounced (yellow-dashed areas) as opposed to regions within the same gut where dysplasia is absent or less pronounced (green-dashed areas). (F) Quantification of pucLacZ signal intensity in ISCs/EBs (Esg positive) and differentiated cells (Esg negative) at 20 d. (G) 20-d-old intestine where mad2RNAi was coexpressed with BskDN in ISCs/EBs. Note the absence of dysplasia. Compare with control and mad2RNAi in Fig. 2. Bars: 40 µm (main images); 20 µm (insets). (H) Quantification of the percentage ISCs/EBs and EEs in control, mad2RNAi, and mad2RNAi + BasketDN. Control and mad2RNAi data are the same as shown in Fig. 3. n = 14 for 10-d mad2RNAi + basketDN; n = 21 for 20-d mad2RNAi + basketDN. Tukey boxplots; **, P < 0.01; ****, P < 0.0001; Mann-Whitney U test. (I) Graphical abstract of results gathered on the impact of aneuploidy induction in the intestine epithelium. BM, basement membrane; VM, visceral muscle.

