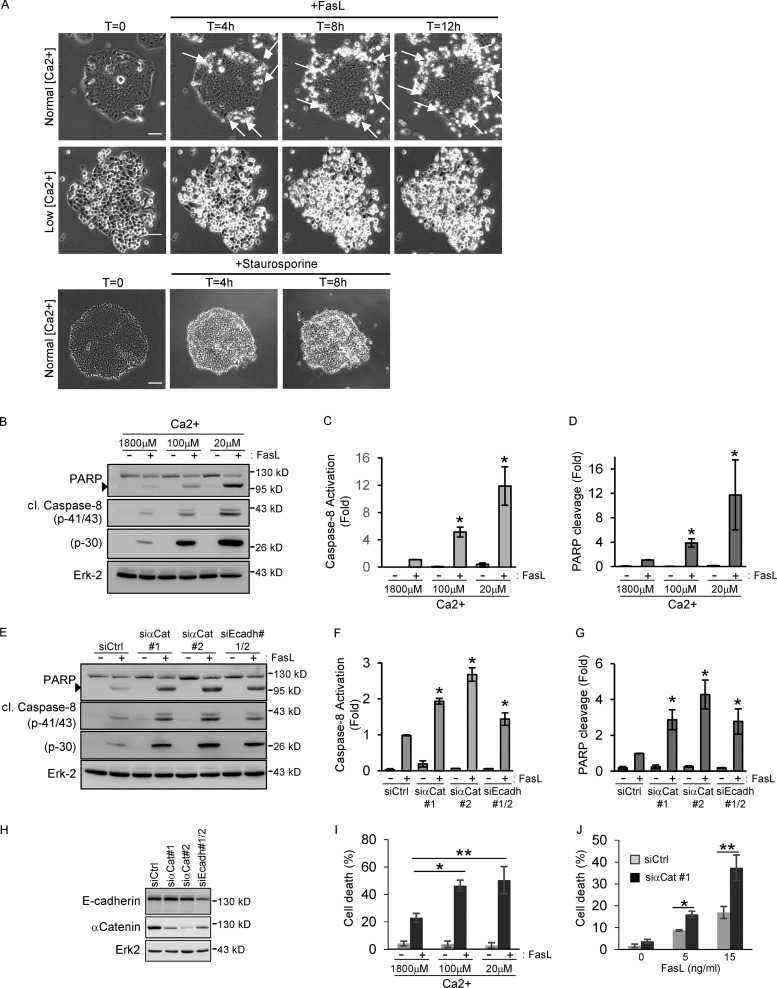
Figure 1.
AJs protect epithelial colon cells from FasL-induced cell death. (A) HCT15 cells were grown in normal media or in low-calcium conditions (20 µM) before FasL (20 ng/ml + M2) or staurosporine (20 µM) treatment. Cell death was analyzed by phase-contrast time-lapse microscopy. Arrows indicate the localization of dead cells. Bar, 50 µm. (B–D) HCT15 cells were grown in media containing various concentrations of calcium (from 1,800 µM [normal conditions] to 20 µM [low conditions]) before FasL treatment (15 ng/ml + M2), and cell death was measured by monitoring caspase-8 activation (presence of p43/41 and p30 cleaved fragments) and PARP cleavage by IB. Relative caspase-8 activation (p41/43) and PARP cleavage were measured by quantitative densitometry (n = 3). (E–G) Cell death was induced by FasL treatment (15 ng/ml + M2) in HCT15 cells transfected with the indicated siRNAs and analyzed by IB as above. IBs were quantified by densitometry (n = 3). (H) The efficiency of each siRNA was verified by IB. (I and J) Cell death was analyzed by sub-G1 quantification (PI incorporation) in HCT15 grown in low-calcium conditions or transfected by the indicated siRNAs. Arrowheads in B and E indicate the cleaved forms of PARP. In all graphs, error bars represent means ± SEM. *, P < 0.05; **, P < 0.01; Student’s t test.

