Figure 2.
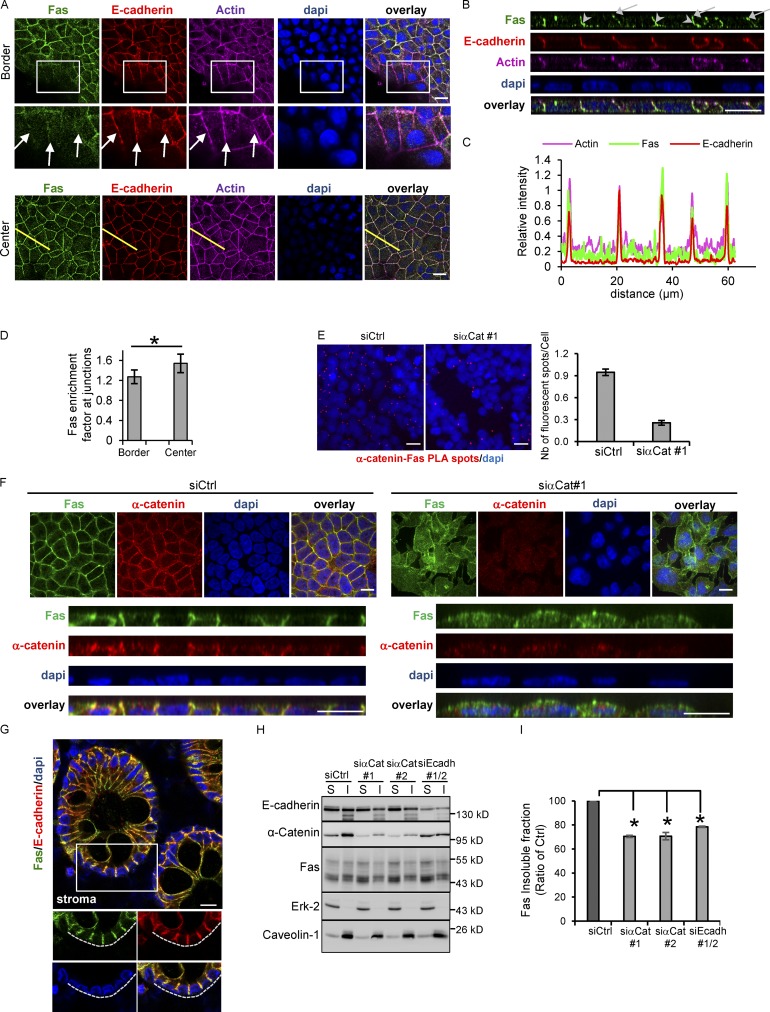
Fas accumulates at cell–cell junctions and colocalizes with AJ components in both colorectal cell lines and colon tissue sections. (A) Detection of E-cadherin, actin, and Fas by IF on HCT15 cells in border or center regions of the cell islet. An enlarged part of images from bordering cells is shown. Arrows indicate the diffuse localization of Fas at the plasma membrane in bordering cells. (B) XZ projection of Z stack acquired in A. Arrows and arrowheads indicate Fas–E-cadherin colocalization both at the zona adherens and along the lateral surface, respectively. (C) Line scan (yellow line in A) profile of fluorescence intensity of Fas, E-cadherin, and actin obtained at the center of the cell islet. (D) Quantification of the specific enrichment of Fas at cell–cell junctions in cells located at the center (confluent area) compared with the border of the HCT15 cell islets. Bars in graphs represent means ± SEM (n = 5). (E) PLA was used to determine the interaction of Fas and E-cadherin in HCT15 cells. Red fluorescent spots indicate colocalization of Fas and E-cadherin. PLA dots/cells in each condition were counted, and the right panel shows the mean of dots/cells ± SEM. One representative experiment is shown out of three. (F) Detection of Fas and α-catenin in HCT15 invalidated for α-catenin expression by using an siRNA approach. A XZ projection of Z stack is shown. (G) IF localization of Fas and E-cadherin in human colon tissue sections using confocal microscopy. (H and I) Fas detergent solubility in HCT15 cells transfected by the indicated siRNAs was analyzed by IB. S, soluble fraction; I, insoluble cytoskeletal fraction. Erk-2 and caveolin-1 were used as controls of soluble protein and membrane protein, respectively. Relative percentage of solubility of Fas in each condition was quantified by densitometry (n = 3). Bars in graphs represent means ± SEM (n = 5). Bars: 10 µM (A, B, E, and F); 20 µM (G). *, P < 0.05; Student’s t test.

