Figure 4.
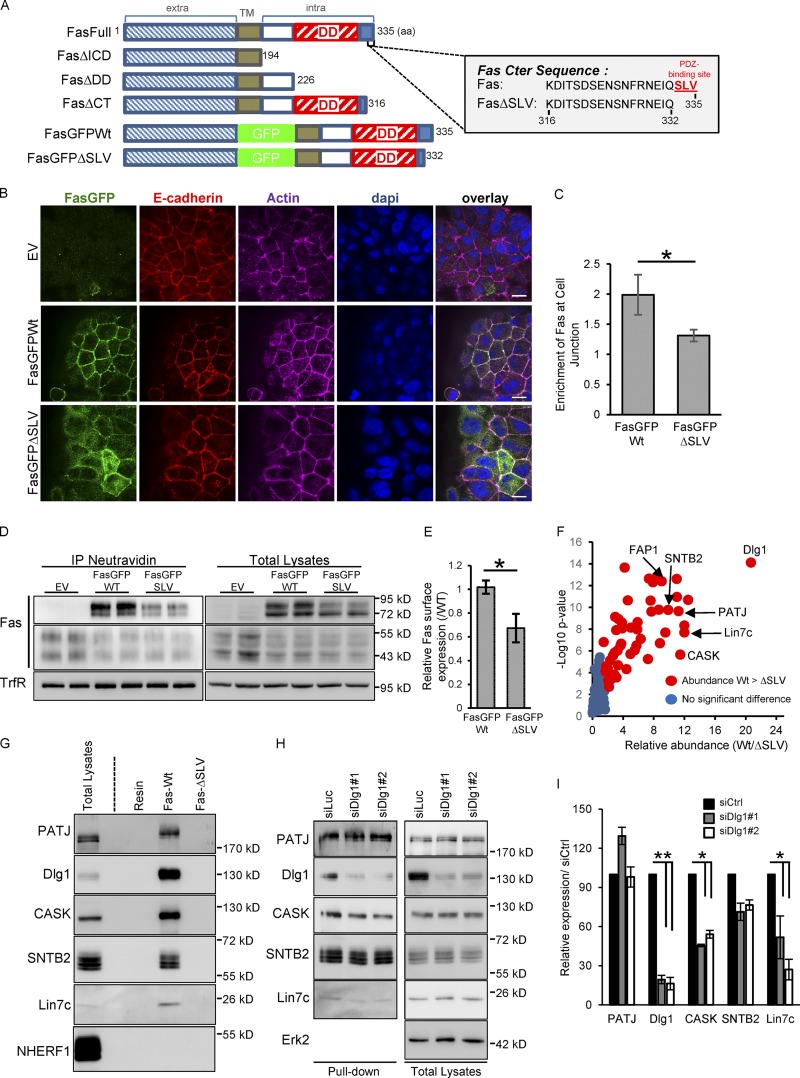
Fas PDZ binding domain regulates Fas cell–cell junction localization and interacts with the polarity molecule Dlg1. (A) Schematic representation of human Fas constructs and of the C-terminal sequence of Fas. The SLV C-terminal PDZ-binding motif is shown in red. TM, transmembrane domain. (B) Detection of E-cadherin and GFP by IF in HCT15 cells transduced with empty vector (EV), GFP-Fas WT, and ΔSLV mutant. (C) Quantification of the specific enrichment of GFP-Fas WT and ΔSLV mutant at cell–cell junctions. Error bars in graphs represent means ± SEM (n = 5). (D) Cell surface expression of GFP-Fas WT and ΔSLV mutant were compared using biotinylation assays. (E) Relative cell surface expression of GFP-Fas WT and of the ΔSLV mutant was quantified by densitometry. Error bars in graphs represent means ± SEM (n = 3). (F) Volcano plot summarizing comparison between the protein interacting with Fas C-terminal (Cter) peptide of WT and the ΔSLV mutant. The log2 ratio of protein intensities was plotted against negative log10 P values. Red circles correspond with proteins significantly more abundant in the WT than in the ΔSLV mutant (P < 0.05), and blue circles correspond with proteins without significant changes. (G) Pulldown experiment done with the C-terminal peptide of Fas (WT or FasΔSLV) followed by IB. (H) Pulldown experiment done with beads coupled to the C-terminal peptide of WT Fas on cell lysates of HCT15 transfected with the indicated siRNAs and followed by IB. (I) Relative expression of each protein pulldown with WT Fas C-terminal peptide was quantified by densitometry (n = 3). Bars, 10 µM. *, P < 0.05; Student’s t test.

