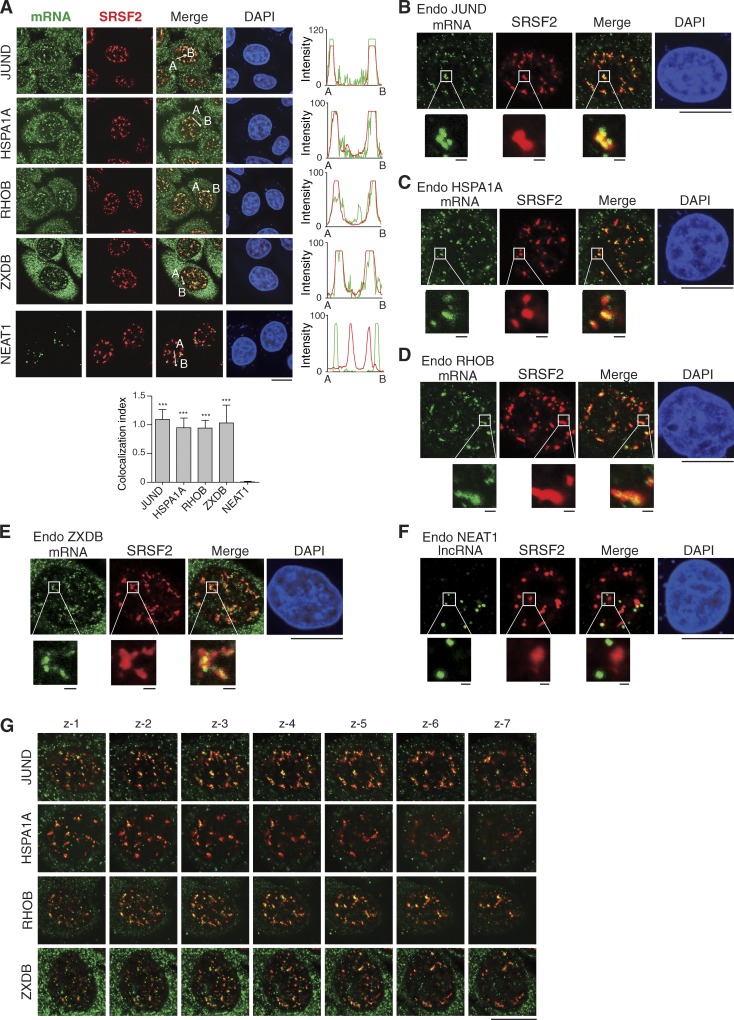
Figure 2.
Endogenous intronless mRNAs associate with NSs. (A) Confocal microscopic images to show distributions of endogenous (Endo) RNAs and NSs detected by FISH with transcript-specific probes and IF with the SRSF2 antibody. To clearly visualize the NEAT1 foci, a shorter exposure is shown. The green and red lines in the graphs demonstrate the RNA and SRSF2 IF signal intensity, respectively. The colocalization index of RNA foci with SRSF2 speckles is shown in the bottom. Data represent the mean ± SD from three independent experiments; n = 10. Statistical analysis was performed using an unpaired t test. ***, P < 0.01. (B) High magnification of a representative cell with the JUND mRNA and SRSF2 detected is shown. The further higher magnification of the boxed region is shown. (C–F) Same as in B except that the HSPA1A mRNA, RHOB mRNA, ZXDB mRNA, and NEAT1 lncRNA were detected. (G) The top to bottom sections of Z-stacked confocal images were taken in steps of 0.5 µm. Bars: 1 µm (magnifications); 20 µm (others).

