Figure 5.
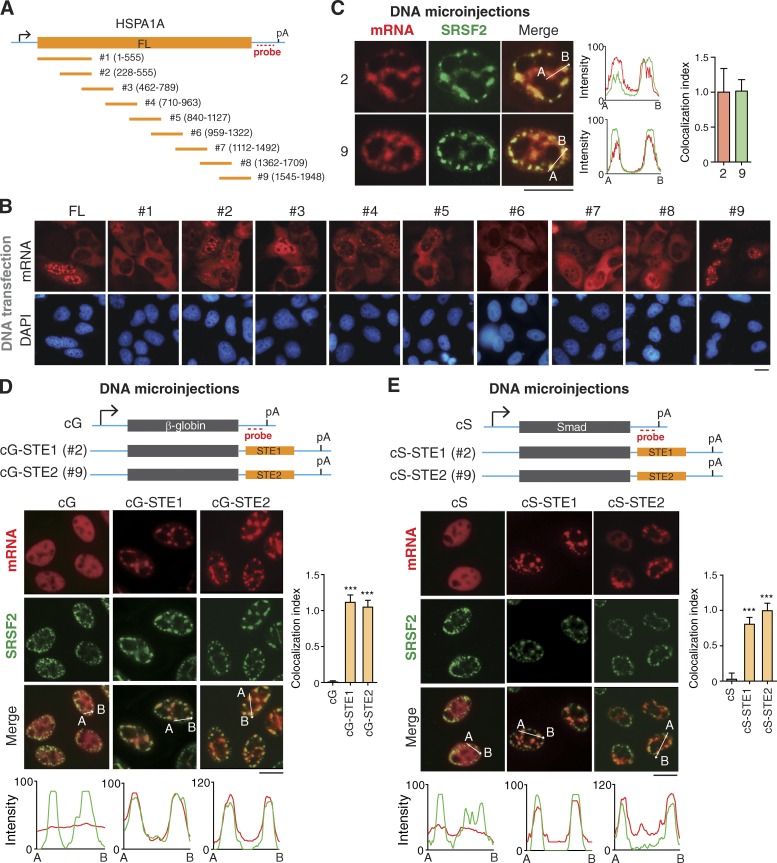
Multiple fragments in naturally intronless mRNAs facilitate speckle targeting. (A) Schematic of the HSPA1A constructs. Sequences from the vector and HSPA1A gene are indicated as a cyan line and an orange bar, respectively. The positions of the promoter, polyA (pA) signal, and FISH probe are marked. FL, full length. (B) Fluorescence microscopic images show the distribution of mRNA fragments transcribed from transfected DNA constructs shown in A. FISH with the 3′ vector probe was performed at 24 h after transfection. (C) Confocal microscopic images show the distribution of HSPA1A fragment mRNAs derived from microinjected DNA construct and NSs. FISH with the 3′ vector probe and SRSF2 IF were performed at 1 h after the addition of α-amanitin. The colocalization index is shown on the right. (D) Top: Schematic of cG constructs. Sequence from the vector is indicated as cyan line, and the regions of the cG and STEs are indicated as a gray and an orange bar, respectively. The positions of promoter, polyA site, and FISH probe are marked. Bottom: Fluorescence microscopic images show the distribution of cG, cG-STE1, and cG-STE2 mRNAs transcribed from microinjected DNA constructs and NSs. α-Amanitin (4 µg/ml) was added 20 min after microinjection. FISH with the 3′ probe and IF with the SRSF2 antibody were performed at 30 min after the addition of α-amanitin. The colocalization index is shown on the right. Data represent the mean ± SD from three independent experiments; n = 10. (E) Same as in D, except that the Smad cDNA transcript (cS) was used. Bars, 20 µm. The red and green lines in the graphs demonstrate the mRNA and SRSF2 IF signal intensities, respectively. Statistical analysis was performed by using the unpaired t test. ***, P < 0.01.

